Fig. 4.

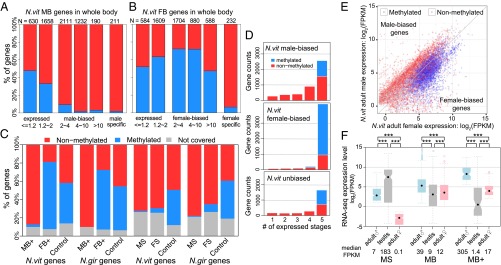
Sex-biased expression, DNA methylation, and expression breadth. (A and B) Barplot of percentage methylated genes in male-biased/male-specific (A) and female-biased/female-specific genes (B) in N. vitripennis adult whole-body samples binned by fold difference between the two sexes. (C) Stacked barplot of percentage of methylated (blue), nonmethylated (red), and uncovered genes (gray). (Left) Extremely male-biased (MB+) and female-biased (FB+) highly expressed genes in N. vitripennis and N. giraulti with control unbiased genes matching their expression level. (Right) Male- (MS) and female-specific (FS) genes in N. vitripennis and N. giraulti with control unbiased genes matching their expression level. (D) Stacked barplot of the number of expressed developmental stages in females (from 1 to 5) for methylated (blue) and nonmethylated (red) male-biased (Top), female-biased (Middle), and unbiased genes (Bottom) in Nasonia whole-adult samples. (E) Scatterplot of male expression level (log2 FPKM) on y axis against female expression level (log2 FPKM) on x axis for N. vitripennis adult whole-body samples, color-coded by DNA methylation status (blue: methylated genes; red: nonmethylated genes). (F) Boxplot of RNA-seq expression level (log2 FPKM) for male-specific (MS), male-biased (MB) and extremely male-biased highly expressed genes (MB+) in male whole-body (blue), male testis (gray), and female whole-body samples (pink). Statistical significance was calculated by Mann–Whitney U test (***P value < 0.001).
