
Fig. S3.
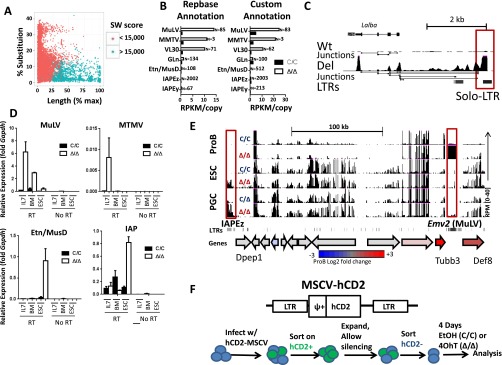
ERV expression in primary pro-B cells. (A) Validation of Smith–Watterman (SW) score cutoff used in classifications. Sequences of repeatmasker annotated ERVs were compared with deposited Repbase sequences and scored for percentage of sequence substitution or length mismatch. ERV annotations were then grouped by a SW cutoff of 15,000. (B) Expression of LTR transposon families as measured by RNA-seq. Total reads were mapped to canonical proviral sequences either annotated in the published Repeatmasker database (SW > 15,000) or a custom annotation using the Cross_Match algorithm (SW > 10,000). Total number of repeative elements were used for counting and normalized for copy numbers within each family of repetitive element. (C) Screen shot (UCSC genome browser) for RNA-seq data from pro-B cells corresponding to the indicated genotypes (0–40 reads per million), which highlights the chimeric ERV-Lalba transcript in Setdb1Δ/Δ cells. RNA-seq junctions are shown below the RPKM tracks. Solo LTR transposons are highlighted by red boxes (*P < 0.05, Student t test). (D) Relative levels of ERV transcripts in pro-B cells and ESC were quantified by qRT-PCR for the indicated genotypes. Pro-B cells were harvested from either IL-7 cultures (Bcl2-transgenic) or sorted directly from bone marrow (BM). For ESC, Setdb1 was excised using tamoxifen-cre and cells were cultured for 4 d following deletion. Control PCR reactions lacking cDNA (no RT) are shown at the right of each panel. Results are averages of three independent experiments, and data are represented as mean ± SEM. (E) Screen shot (UCSC genome browser) for RNA-seq data from pro-B, ESC, and PGCs corresponding to the indicated genotypes (0–40 reads per million). Full-length LTR transposons are highlighted by red boxes. The panels below show positions of ERV-LTRs and a cartoon depiction of coding genes within the region. The latter is color-coded for relative gene expression (microarray data) in mutant vs. WT pro-B cells (red, up-regulated in Setdb1∆/∆; gray, no change; blue, down-regulated in Setdb1∆/∆). (F) Plasmid map and flowchart for the experiment shown in Fig. 4.