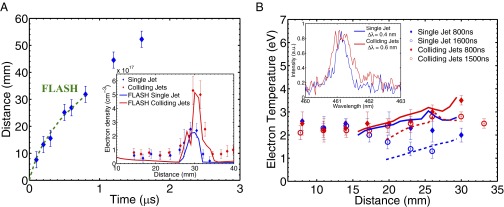
Fig. 2.

Characterization of jet propagation and collision. (A) Measurement of the jet leading edge vs. time from Schlieren data (blue symbols) and FLASH simulations (dashed green line). The FLASH simulation was calibrated to match the position of the leading edge of the jet at 800 ns for the measured value of the total laser energy for that data point. (Inset) The electron density profile obtained by interferometry at ns compared with FLASH predictions. The density has been averaged over a volume of 5 mm radius from the axis connecting the two target foils. (B) Spatially resolved electron temperature profile of a single jet (blue symbols) and colliding jets (red symbols) at ns obtained from the measured argon spectral lines (see Supporting Information for details). Solid lines (blue, single jet; red, colliding jets) correspond to the predicted temperature values from FLASH simulations at ns, averaged over the same volume as the electron density. Dashed lines are the results from the same FLASH simulations at ns. (Inset) An example of the argon spectral line at ns and 3 cm from the carbon foil target (averaged over 0.1 cm).
