
Fig. 3.
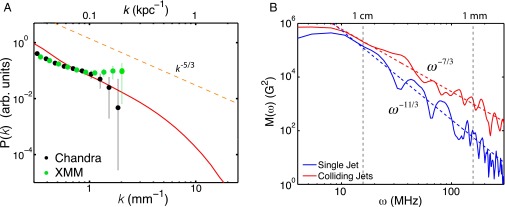
Power spectra of turbulence. (A) Plot of the density fluctuation power spectrum , where is the discrete Fourier transform of the space-dependent electron density and is its average value. In Schlieren imaging, the measured signal intensity is proportional to , where n is the electron density, x,y are the image plane spatial coordinates, and z is the depth (35). Therefore, under the assumption that turbulence is statistically homogeneous across the jet interaction region, the discrete Fourier transform of the central region of the jet collision in Fig. 1C directly gives . The power spectrum is arbitrarily normalized so that at the largest scale. The solid red curve corresponds to the experimental data, while the black and green symbols correspond to the inferred density spectrum in the Coma cluster obtained from CHANDRA and XMM satellite observations, respectively (25). (B) Plot of the magnetic energy spectrum , where is the discrete Fourier transform of the total magnetic field for the cases both with a single jet (blue solid line) and with colliding jets (red solid line). The slope of the spectrum in the case of colliding jets is shallower than in the case of a single jet (where it is consistent with the Golitsyn spectrum, assuming conversion from frequencies to wavenumbers according to Taylor hypothesis, ). This gradual shallowing of the spectrum with increasing Rm is a signature of the dynamo precursor regime (31). The measured frequency spectrum, , can be argued to correspond to wavenumber spectrum, , in the case of colliding jets, where Taylor's hypothesis is inapplicable (see Supporting Information).