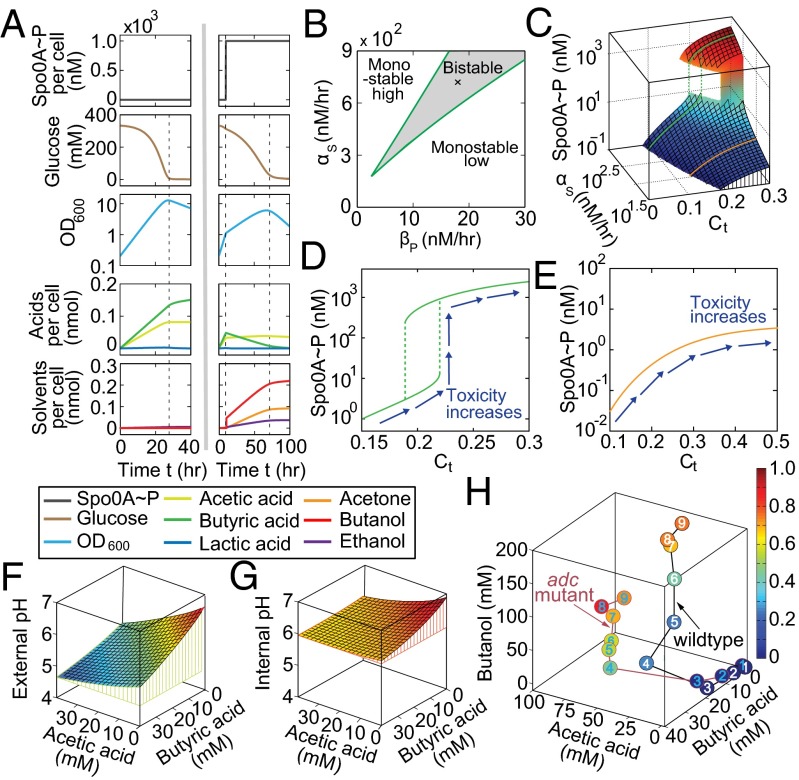
Fig. 2.
Construction and characterization of individual modules. (A) The metabolic reaction module. (Left) A simulated ABE fermentation with Spo0A remaining low through the entire course, corresponding to an acidogenic fermentation or a fermentation using the spo0A mutant. The fermentation produces high amounts of acids but no solvents. (Right) A simulated fermentation with Spo0A switched on during fermentation, corresponding to a typical ABE fermentation using the WT strain. Compared with Left, this fermentation has reduced accumulations of acids but increased amounts of solvents. (B–E) The genetic regulation module. (B) Phase diagram of the network dynamics with respect to the positive regulation of σK (αs) and the dephosphorylation of Spo0A∼P (βp). Regardless of the initial conditions, Spo0A∼P concentrations can remain high or low for parameters in the upper left or lower right region, respectively. The parameters in the beaker region generate a bistable activity of Spo0A∼P, whose level may be high or low depending on the initial values of the system. (C) The Spo0A∼P concentration as a function of the strength of the positive regulation of σK (αs) and cellular toxicity (Ct). There are two types of the input–output relationships, with one discontinuous (green) and the other continuous (orange). (D and E) Two representative Spo0A∼P profiles in C. Despite the presence of differential behaviors, both profiles show monotonic increase of the Spo0A∼P (system output) with cellular toxicity (system input). (F–H) The module for environmental cues. (F and G) Computed extra- and intracellular pH values for given levels of acetic acid and butyric acid in MS-MES medium. (H) Computed cellular toxicity during the course of two fermentations that use the WT and adc mutant strains, respectively (27). The colors of the circles indicate toxicity level, and the numbers refer to different time points.

