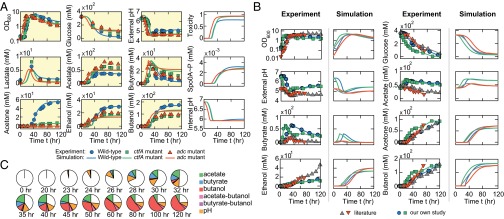
Fig. 3.

Calibrations and primary tests of the integrated model. (A) Comparison of simulated ABE fermentations with the data from previous experimental reports. Combining the modules for metabolic reactions, gene regulation, and environmental cues, the integrated model was able to reproduce the pH-uncontrolled fermentations of the WT (blue lines), ctfA-knockout (green lines), and adc-knockout (red lines) strains. The corresponding experimental results (blue circles, green squares, and red triangles) were adapted from previous studies (27). (B) Additional comparisons of experimental and computational metabolite profiles for the pH-uncontrolled fermentations that use the WT strain. The experimental data with blue circles and green squares were obtained from our own fermentations; the data with gray triangles (28) and red inverted triangles (29) were adapted from previous studies. (C) Computed time evolution of the cellular toxicity during the pH-uncontrolled WT fermentation in A (corresponding to the blue lines).
