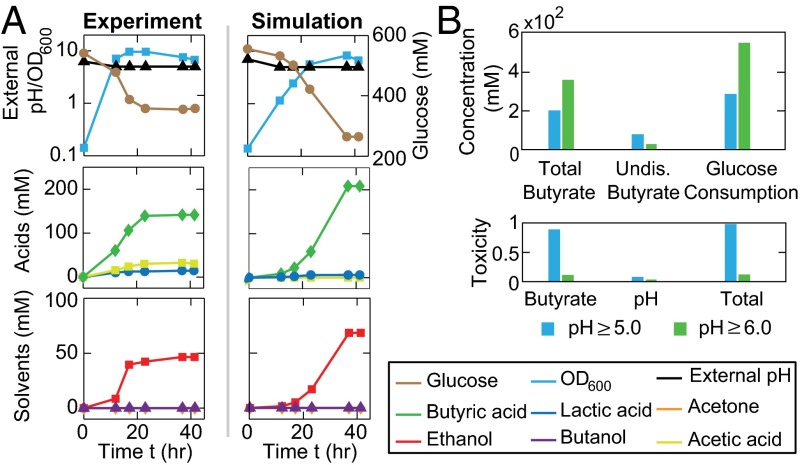
Fig. 4.
Perturbations of the metabolic reaction network. (A) Comparison of the simulated and experimental fermentation patterns for a pta-ctfB-adhE knockout strain (30), where both have an enhanced butyrate accumulation but minimal productions of acetate and all of the solvents. pH is controlled above 5.0. (B) Computed glucose consumptions, total and undissociated butyrate, and cellular toxicities of the fermentations using the pta-ctfB-adhE mutant, for the cases when pH is controlled above 5.0 and 6.0.

