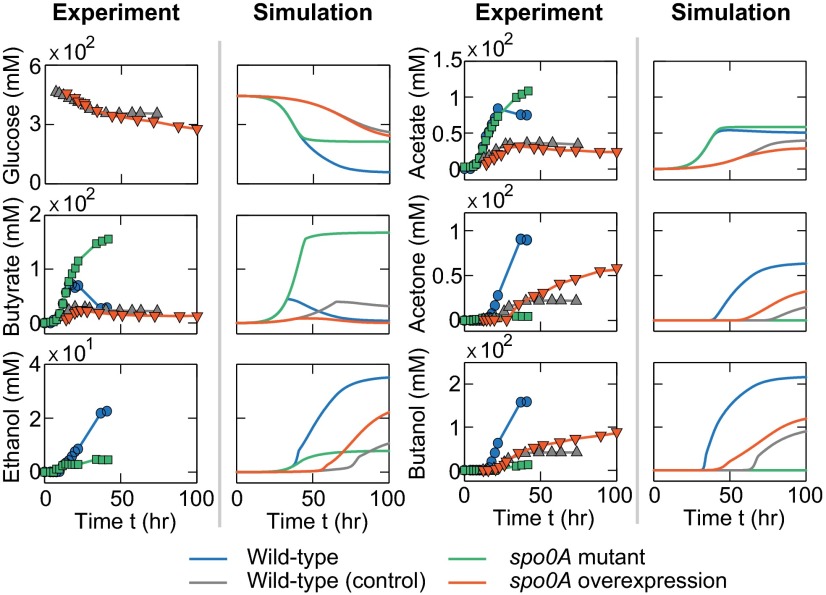
Fig. 5.
Comparison of the computational and experimental fermentation profiles for the strains with genetic network perturbations. The fermentations of the spo0A-knockout (green lines), spo0A overexpression (red lines), and their control (blue and gray lines) strains were simulated with the integrated model and further compared with corresponding experimental results reported in previous studies [green squares (33), red triangles (34), blue circles (33), and gray triangles (34)]. Notice that the experimental data do not include the glucose consumptions of the WT and spo0A-mutant strains and the ethanol yields for the spo0A overexpression strain and its control, due to the lack of information in the original literature.

