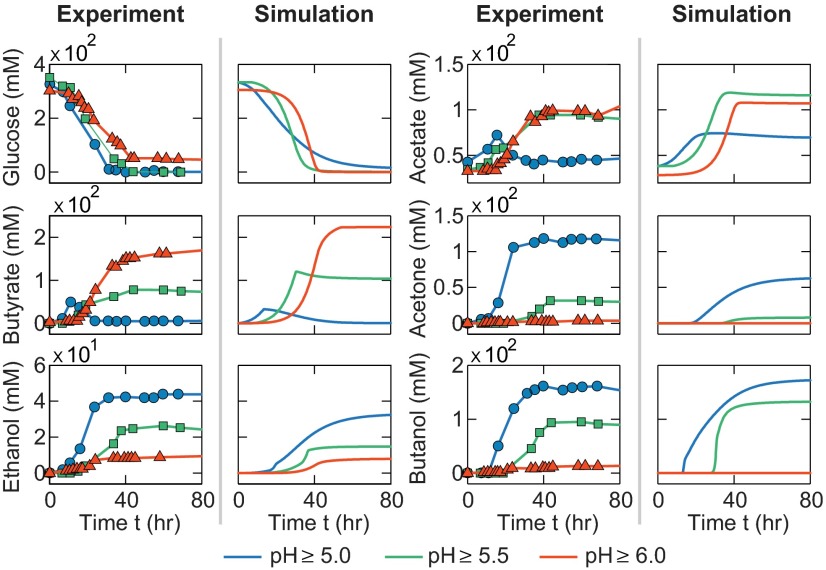
Fig. 6.
ABE fermentation profiles upon the perturbations of the environmental cues (pH control). Fermentations with external pH controlled above 5.0 (blue lines), 5.5 (green lines), and 6.0 (red lines) were simulated using the integrated model. For comparison, experimental results are also presented with the blue circles (36), green squares (36) and red triangles (35) corresponding to the fermentations with external pH controlled above 5.0, 5.5, and 6.0, respectively.

