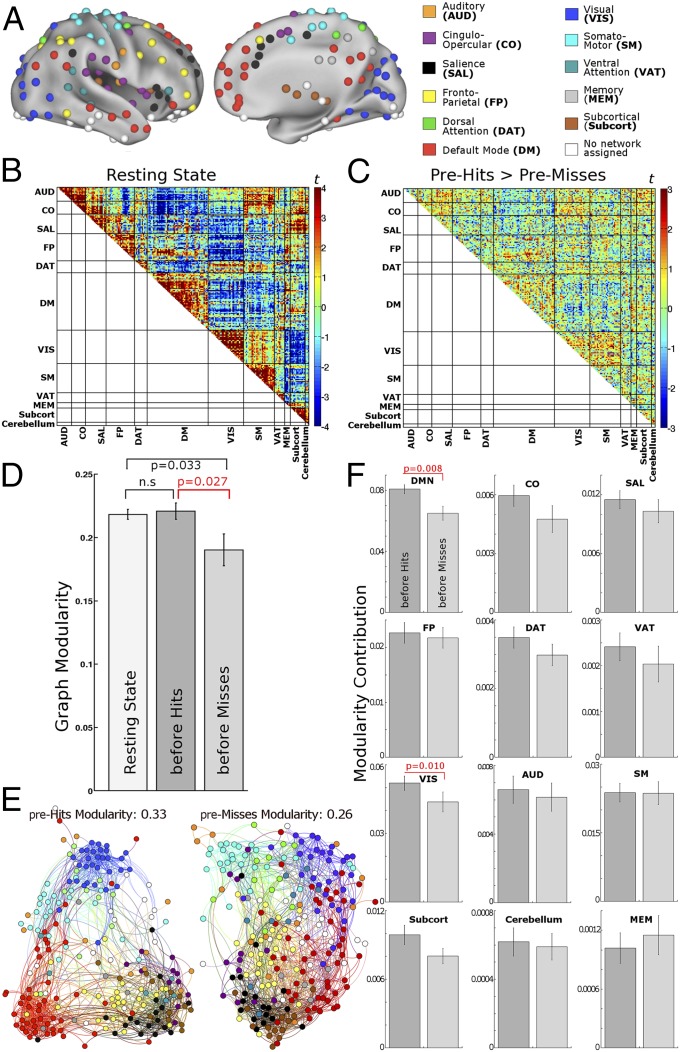
Fig. 4.
Graph construction and graph modularity. (A) Nodes from a functional atlas defined on the combined basis of resting-state functional connectivity and a meta-analysis of cognitive tasks (1). (B) Resting-state correlation pattern across the nodes. This pattern with strong connectivity within the atlas modules shows that the predefined modular partition structure of the atlas reflects the data structure well. (C) Difference in functional connectivity of pre-hits baseline > pre-misses baseline (compare with Fig. 2B). Difference between task and resting state is in SI Text, section 7 and Fig. S5. (D) Graph modularity was reduced before misses compared with hits and task-free resting state. P values are Bonferroni-corrected. (E) A visual representation of the modularity difference before hits vs. misses for a representative individual participant (cost 0.05). This representation is generated by a force-field algorithm that treats nodes as magnets repulsing each other, whereas edges act as springs attracting the nodes that they connect (37). The configuration onto which these forces converge is visibly more modular before hits compared with misses. Networks (modules) are colored as in A. Most notably, DM (red) and VIS (dark blue) modules are less segregated from the rest of the graph before misses. (F) Contribution of individual modules to overall graph modularity. The strongest contribution to modularity difference was from DM and VIS networks. All error bars show SEMs. n.s., not significant.

