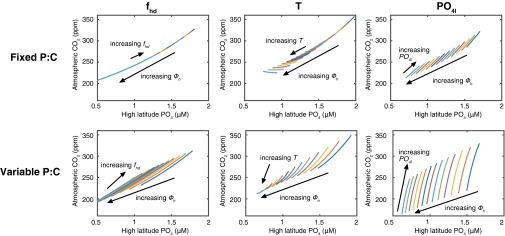
Fig. 3.

Relationship between preformed PO4 and pCO2 in box model simulations. Top panels show results with fixed P:C, bottom panels show variable P:C following the Line of Frugality illustrated in Fig. 1. Each panel shows the pCO2 predicted by 100 model simulations that simultaneously vary the high-latitude export flux (Φh, each value of which is shown by a single color) along a range of values for the other variable as indicated (shown as a continuous line for each value of high-latitude export), where PO4l is low-latitude PO4, T is thermohaline overturning and fhd is high-latitude vertical mixing. For example, for the variable P:C model, varying PO4l over the full range of values produces pCO2 changes of more than 70 ppm, with little effect on the preformed PO4.
