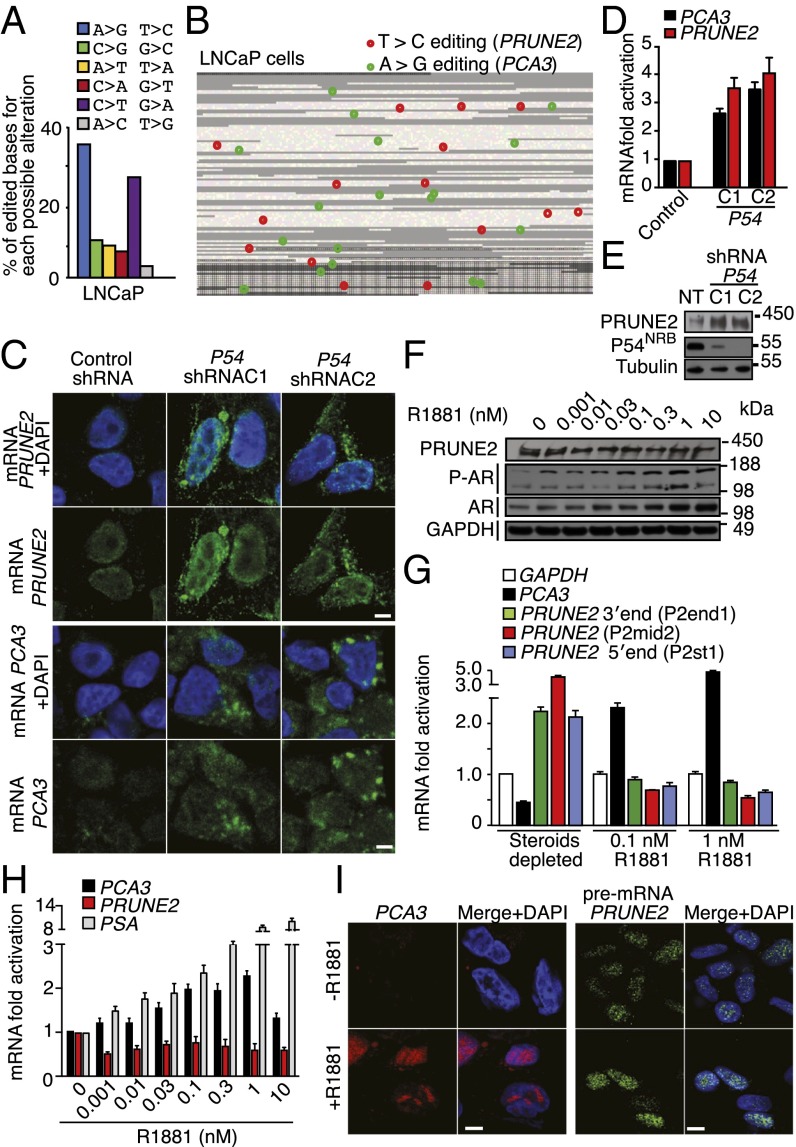
Fig. 3.
Functional role of RNA editing and androgen receptor (AR) activation in PRUNE2/PCA3 regulation. (A and B) Identification, quantification, and distribution of A > G/T > C changes (features pathognomonic of A-to-I editing in both strands of the PRUNE2/PCA3 dsRNA) analyzed after RNA capture followed by high-throughput sequencing. Reads were aligned against hg19 of the region. Only nondbSNP variations indicated by at least three reads, and out of repetitive elements were considered. (A) Distribution and percentage of all possible alterations for the PCA3 genomic coordinates in LNCaP cells are shown. (B) RNA editing map for LNCaP cells showing the precise location of each A > G (green) or T > C (red) sites over PCA3 and intron6-PRUNE2 pre-mRNA species. Each square represents one individual base from the PCA3 locus (23,112 nt). Black borders delimit the bases of the four annotated exons (3,923 nt). Repeats (RepeatMasker) are shown in gray (B). (C–E) Evaluation of PCA3 and PRUNE2 levels in LNCaP cells stably expressing two independent P54NRB-shRNA clones (C1 and C2) or controls (NT). Detection of PCA3 and PRUNE2 mRNA cytosolic levels by RNA-FISH (C) and by qRT-PCR (D) are shown. Analysis of PRUNE2 expression in LNCaP P54NRB-silenced cells or negative control is shown (E). (F) Analysis of PRUNE2, AR, and phosphorylated AR (P-AR) expression in after concentration-dependent androgen stimulation with R1881. Representative PAGE 3–8% shown. (G) Relative mRNA expression levels of PCA3 and PRUNE2 transcript under R1881 stimulation. (H) Relative mRNA expression of PRUNE2, PCA3, and PSA (positive control) measured by qRT-PCR in LNCaP cells after dose-dependent R1881 stimulation. (I) RNA-FISH analysis for PCA3 and pre-mRNA of PRUNE2 in LNCaP cells under steroid-depleted conditions or after androgen stimulation.

