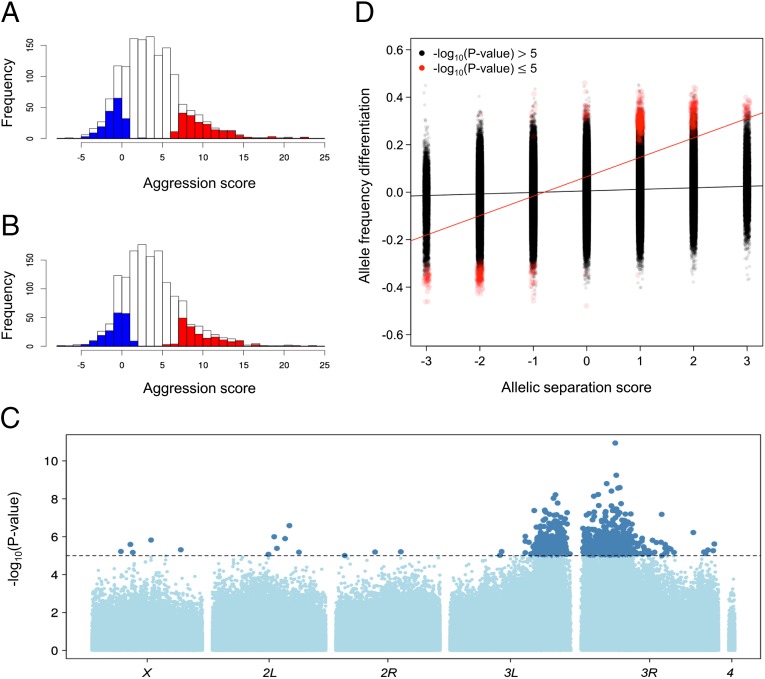
Fig. 2.
Aggressive behavior in the AIP. (A and B) Histograms of aggression scores in the AIPs. Individuals with extreme high and low scores selected for pooled sequencing are shown in red and blue, respectively. (A) Replicate 1. (B) Replicate 2. (C) GWA analysis for aggression using extreme QTL mapping. The dashed line indicates the nominal P < 10−5 reporting threshold. (D) Association of allelic separation scores for all loci segregating in the pooled AIPs (x axis) and the allele frequency difference between high and low parental lines (y axis). The red circles denote the top variants associated with aggressive behavior (P < 10−5), and the black circles denote the remaining variants. The trend lines depict the regression of allele frequency difference in the high and low pools in the AIP on the allelic separation score for the significant variants (red line) and the remaining variants (black line).

