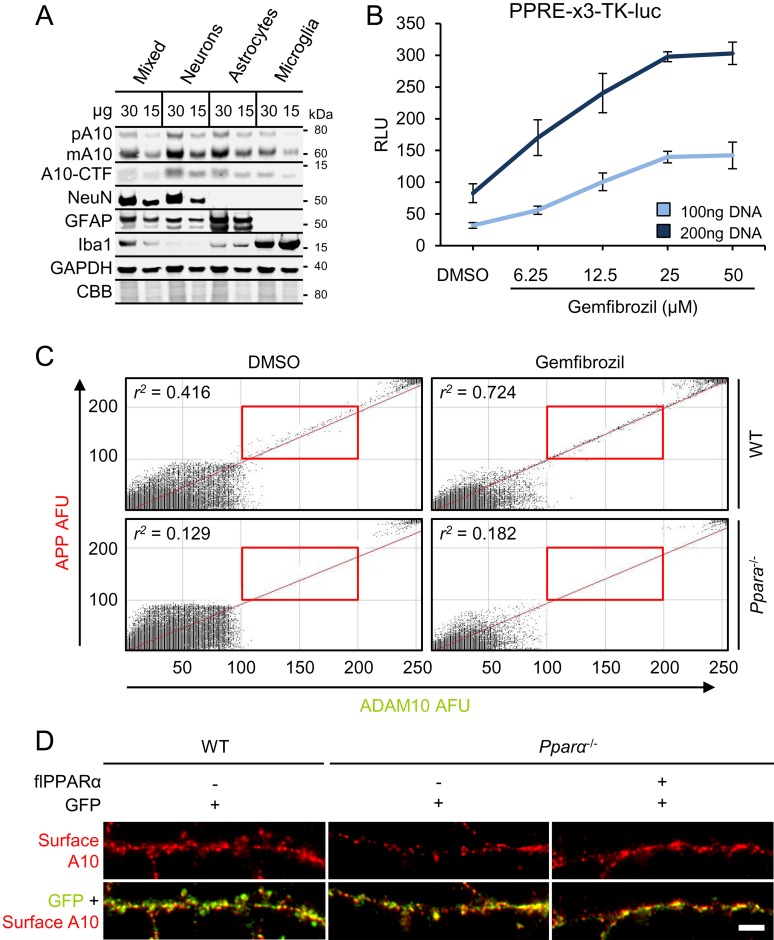
Fig. S2.
(A) Representative immunoblots of precursor (pA10), mature (mA10), and CTF (A10CTF) ADAM10 expression in membranes (30 and 15 µg) prepared from mixed cultures and serially isolated neurons (18DIV), astrocytes (14DIV), and microglia (16DIV). NeuN, glial fibrillary acidic protein (GFAP), and ionized calcium-binding adapter molecule 1 (Iba1) served as markers for neurons, astrocytes, and microglia, respectively. (B) Relative PPRE firefly luciferase luminescence units in 18DIV neurons treated with increasing concentrations of Gem for 2 h after 48 h transfection with 100 or 200 ng PPRE-x3-TK-luc DNA. (C) Colocalization probability (Pearson’s r2) of ADAM10 (y axis) and APP (x axis) surface immunoreactivity in 18DIV WT and Pparα−/− neurons treated for 24 h with DMSO or 25 µM Gem. Red boxes represent puncta within empirically determined thresholds between 100 and 200 arbitrary fluorescence units. (D) Representative immunocytochemical images of surface ADAM10 and GFP expression in live-stained, unpermeabilized 18DIV WT neurons transduced with GFP alone and in Ppara−/− neurons transduced with GFP alone or with flPPARα. Corresponding quantification is presented in Fig. 2N. (Scale bar, 5 µm.) All values represent the mean ± SEM relative to control and represent n = 3 or 4 for each treatment, except for C, where n ≥ 20. µg, micrograms protein.

