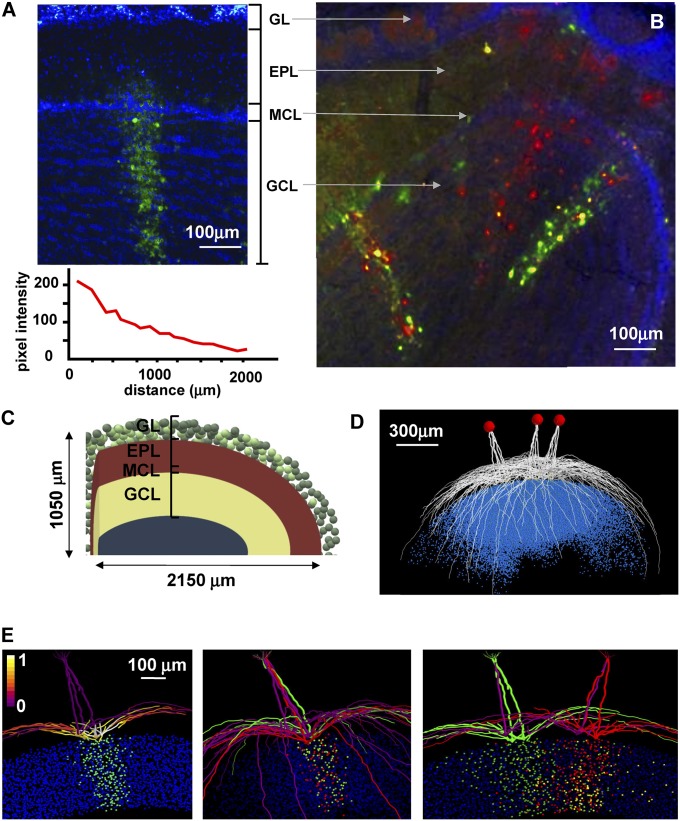
Fig. 1.
A 3D model can reproduce single- and multicolumn formation, as observed in the experiments. (A and B) The main experimental results we used as a reference to study single- and multiple-column formation. A adapted from ref. 6. B adapted from ref. 7. (C) A schematic representation of the 3D model we used for all simulations. Adapted from ref. 10. (D) A model visualization of the mitral cells belonging to three different glomeruli; blue dots represent the soma of the granule connected to them. (E, Left) Typical findings for a single column; the picture shows the final weight configuration from a simulation in which glomerulus 37 was strongly activated with a peak individual synaptic conductance of 6.5 ± 1.95 nS; (Middle) the set of granule cells connected to the red and green mitral cells are distinct, whereas (Right) there are granule cells making synapses on MCs from different glomeruli (in yellow); for this simulation, glomeruli 37 and 123 were activated. The photos in A and B show coronal sections of the olfactory bulb, with labeling of columns of granule cells. EPL, external plexiform layer; GCL, granule cell layer; GL, glomerular layer; MCL, mitral cell layer. Mitral cell dendritic segments in the left plot are color coded according to the normalized peak inhibitory conductance they receive from the GCs, and green colored points below the mitral cells represent somas of granule cell in which at least one synapse was strongly potentiated (more than 95% of its peak value); in the middle and right panels, colors (red, green, and yellow) are used to distinguish cells belonging to different group.

