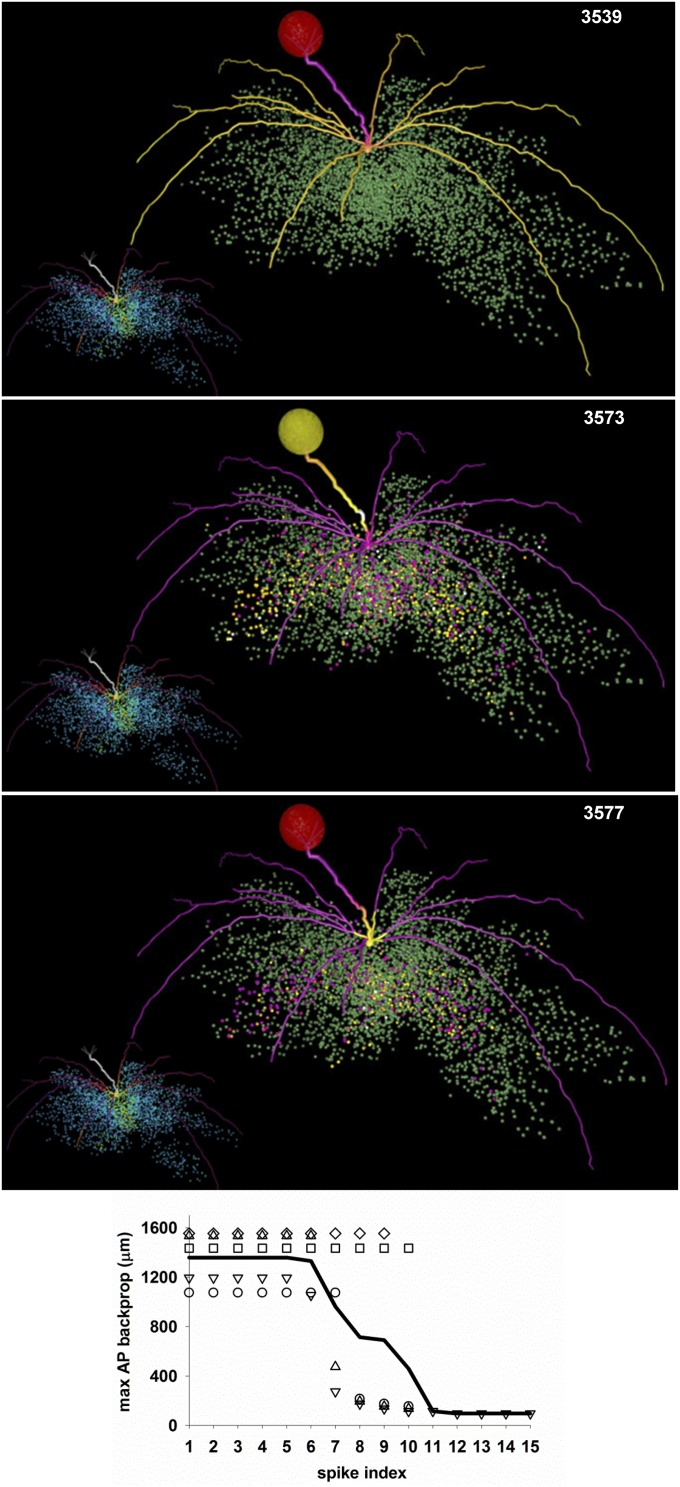
Fig. 2.
Columns block AP backpropagation in mitral cell dendrites. Three selected snapshots from the simulation shown in Movie S1. The mitral cell dendrites are shown color-coded for membrane potential; inactive dendritic segments are shown in purple, APs in yellow. The glomerulus is colored according to the instantaneous spiking activity in the mitral cell tufts; red indicates no activity, yellow indicates spiking activity in any of the tuft dendrites. In the inset of each snapshot, the colored points represent granule cell somas color-coded according to the peak inhibitory conductance of their synapses on the mitral cells. A full high-definition movie can be downloaded from ModelDB. (Bottom) The max AP backpropagation as a function of the spike number; symbols represent each of the five MCs belonging to the glomerulus; the black line is the average.

