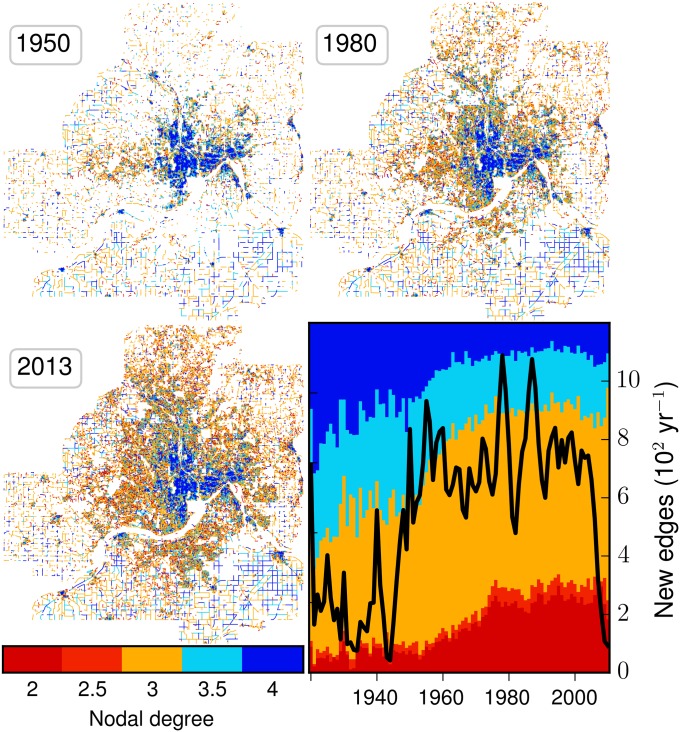
Fig. 3.
Spatial and temporal patterns of sprawl in the Minneapolis–St. Paul region. Individual edges—that is, road segments bounded by two intersections—are shown at three time points. Edges are colored in five categories according to their connectivity, ranging from highly connected (gridded) in blue to cul-de-sacs in red. Connectivity is measured by the mean degree of an edge’s two terminal intersections, explained in the text. Because nodes can be cul-de-sacs, degree three, or degree four-plus, there are five possible values of edge degree, ranging from 2.0 to 4.0. In 1950, the developed area is largely gridded, but growth by 1980 and by 2013 is largely of the low-connectivity kind. Rural roads also tend to be gridded. The Lower Right panel shows the fraction, indicated by the vertical extent of a color, of each edge type built each year. The black line shows the pace of construction, defined as the number of edges dated to each year. Dramatic drops are evident during the Depression, World War II, oil shocks, a recession in the 1970s and 1980s, and the recent Global Financial Crisis. We focus on Minneapolis–St. Paul because all seven central counties are included in our parcel-based data and because the region closely tracks national trends (SI Appendix, Fig. S6).

