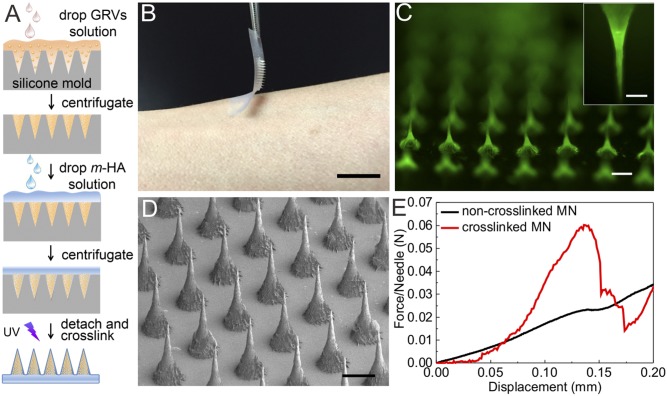
Fig. 4.
Characterization of GRV-loaded MN-array patches. (A) Schematic of the fabrication process of GRV-loaded MN-array patches from a silicone mold. (B) Photograph of the smart insulin patch with an MN array. (Scale bar: 1 cm.) (C) Fluorescence microscopy image of MN-loaded GRVs with FITC-labeled insulin. (Inset) Zoomed-in image of MN. (Scale bars: 200 μm.) (D) SEM image of MN array. (Scale bar: 200 μm.) (E) Mechanical behaviors of the non–cross-linked and cross-linked GRV-loaded MNs.

