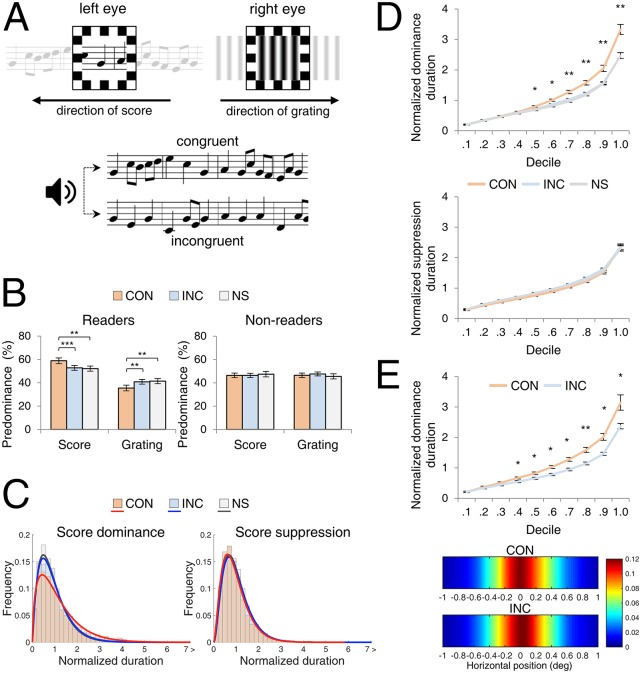
Fig. 1.
Experiment 1. (A) Schematics of rival stimuli and AV conditions. (Upper) One eye viewed a single-note musical score scrolling right to left, and the other eye viewed a vertical grating scrolling left to right. (Lower) In some trials, the participant heard an auditory melody that either matched (CON) or did not match (INC) the visual score; in other trials (not illustrated) no melody was heard (NS). (B) Predominance plotted for readers and nonreaders; pairs of predominance values for a given AV condition do not necessarily sum to 100%, because total trial duration included brief periods of incomplete dominance (i.e., mixtures, which comprised 5.6, 6.4, and 6.5% of the total viewing time for CON, INC, and NS conditions, respectively, values that are not significantly different when examined using ANOVA). Predominance values computed with mixtures excluded produce exactly the same pattern of results. **P < 0.01, ***P < 0.001. Error bars denote SEM. (C) Frequency histograms showing the relative proportion of normalized dominance durations for score and for grating (i.e., score suppression) in readers in CON trials (orange), INC trials (blue), and NS trials (gray). (D) Decile plots for normalized score dominance durations and for normalized score suppression durations. *P < 0.05, **P < 0.01, FDR corrected. Error bars represent SEM. (E) Eye movement measurement in control experiment 1. (Upper) Decile plot of normalized score dominance durations for CON and INC conditions. *P < 0.05, **P < 0.01, FDR corrected. (Lower) Heat-maps showing horizontal gaze stability for CON and INC trials. The key indicates the mapping between color and incidence of fixation, with warm colors denoting greater incidence of fixation on the given spatial location of the rival target area.

