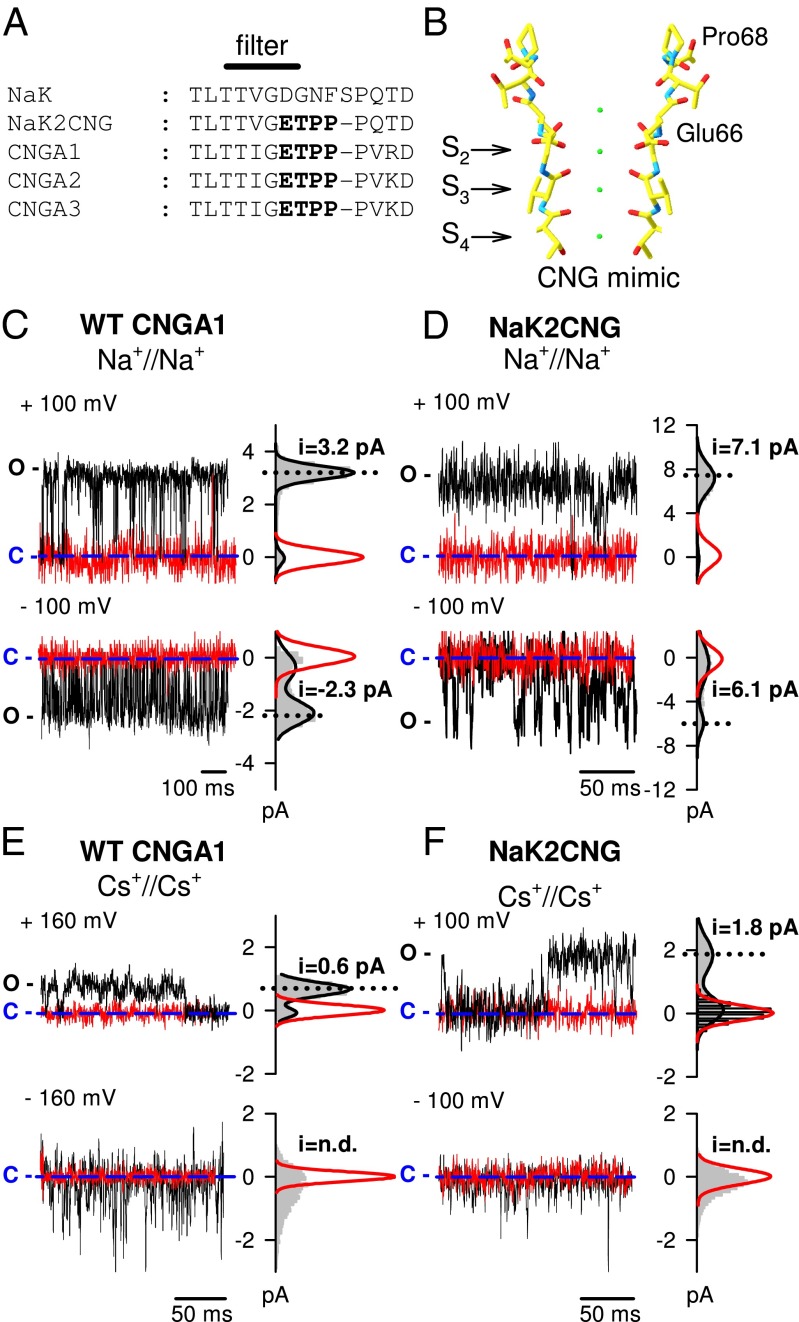
Fig. 1.
Single-channel recordings in the presence of Na+ and Cs+ in the NaK2CNG and CNGA1 channels. (A) Sequence alignment of the selectivity filter of the bacterial NaK channel, the CNG-mimicking NaK chimera (NaK2CNG) and the bovine subunits CNGA1–CNGA3. The ETPP motif in the CNG signature is marked in bold. (B) Structure of the selectivity filter of the CNG-mimicking NaK channel in complex with K+ ions (PDB ID: 3K0D). (C) Current recordings from a single WT CNGA1 channel at +100 mV (Upper) and −100 mV (Lower) in the presence (black traces) and absence (red traces) of 1 mM cGMP in symmetrical 110 mM Na+ solution. (D) Current recordings from a single CNG-mimicking NaK chimeric channel at +100 mV (Upper) and −100 mV (Lower) in the absence (black traces) and presence (red traces) of 30 µM TPeA in symmetrical 110 mM Na+ solution. (E) As in C but in symmetrical 110 mM Cs+ solution and at ±160 mV. (F) As in D but in symmetrical 110 mM Cs+ solution. Amplitude histograms for recordings in the presence of 1 mM cGMP and in the absence of 30 µM TPeA for the WT and the mimic channel, respectively, are shown on the right (gray area). Black lines represent a two-term Gaussian fit to the histograms. Red lines represent a one-term Gaussian fit to the histograms for recordings in the absence of 1 mM cGMP and in the presence of 30 µM TPeA for the WT and the mimic channel, respectively. Blue dashed lines indicate the 0 current level. C and O refer to the closed and open states, respectively.

