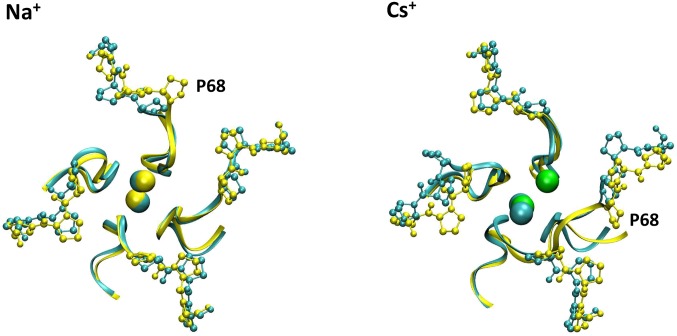
Fig. S6.
Top view of the channel at different V. Figure reports a top view of the superposition of the channel at −0.2 V (cyan) and at +0.2 V (yellow). The backbone of the selectivity filter is shown in ribbons, the Pro68-70 residues are shown in balls and sticks, and the Na+ and Cs+ ions are shown as cyan/yellow and cyan/green at the two voltages.

