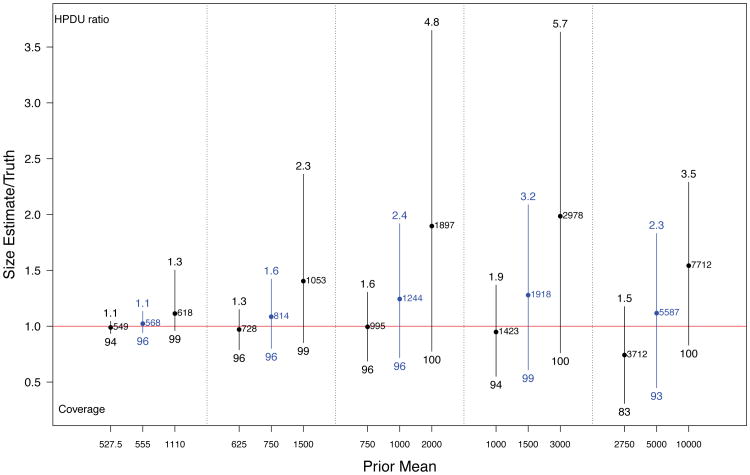
Fig 5.
Spread of central 95% of simulated population size estimates (posterior means) for 5 population sizes for low, accurate, and high priors. Dots represent means. Estimates are represented as multiples of the true population size (red line at 1 indicates true population size). Numbers below the bars are coverage rates of 95% HPD intervals, numbers above the bars indicate the widths of these intervals (ratio of median upper bound to truth).

