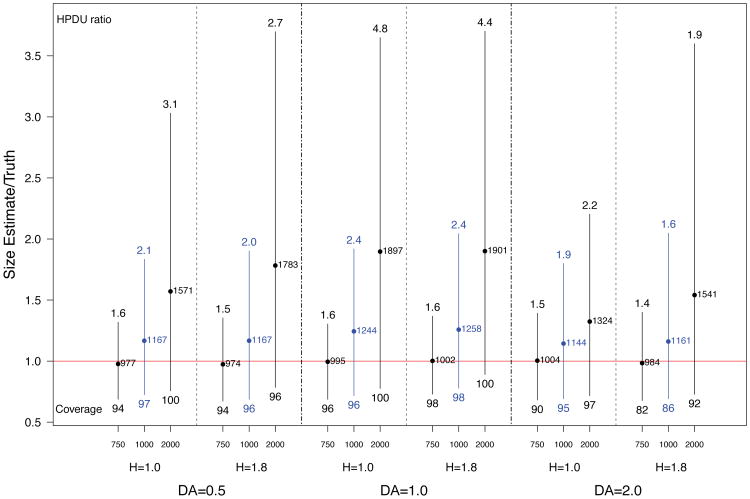
Fig 6.
Spread of central 95% of simulated population size estimates (posterior means) for population size 1000 for low, accurate, and high priors, with varying levels of homophily (H) and differential activity (DA). The legend is the same as Figure 2.

