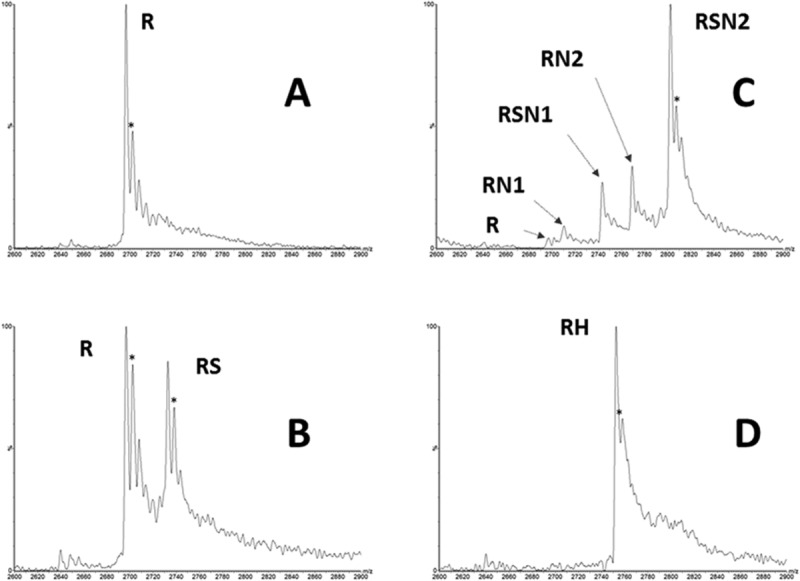
Figure 8.

Mass spectrometry measurements of Rev-erbα interactions with ligands and corepressor. Native mass spectrometry experiments were performed using an ESI-MS instrument (see “Materials and Methods” for details). (A) Rev-erbα LBD alone (20 µM); (B) Rev-erbα LBD (20 µM) incubated with 100 µM of SGN complex; (C) Rev-erb αLBD (20 µM) was incubated with 40 µM of NCoRID1 in the presence of 100 µM of SGN; (D) Rev-erb αLBD (20 µM) was incubated with 40 µM hemin (2 equivalents) in the presence of 100 µM of SGN (5 equivalents). R: Rev-erbα LBD. Expected mass: 29651.5 ± 0.7 Da; RS: Rev-erbα LBD-SGN. Expected mass: 30049.5 Da. RN1: Rev-erbα LBD-NCoR(T-S). Expected mass: 32510.5 Da; RSN1: Rev-erbα LBD-NCoR(T-S). Expected mass: 32909.5 Da; RN2: Rev-erbα LBD-NCoR(biot-S). Expected mass: 33218.5 Da; RSN2: Rev-erb αLBD-NCoR(biot-S)-SGN. Expected mass: 30049.5 Da; RH: Rev-erbα LBD–hemin. Expected mass: 30266.5 Da. Symbols: *, gluconoylated HT-Rev-erb adduct; *P, phospho-gluconoylated HT-Rev-erb adduct.
