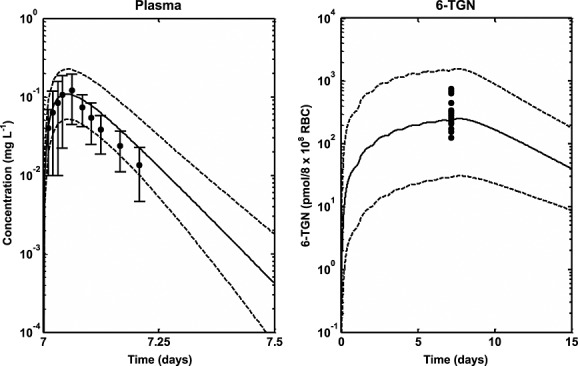
Figure 6.

Median profiles (continuous lines), 95% prediction intervals (broken lines) and observed data for plasma 6-MP (filled circles and line bars) and intracellular RBC 6-TGN (filled circles) following oral dosing of 6-MP in ALL children who received standard dose (75 mg m–2) for a minimum of 7 consecutive days 40
