
Figure 4.
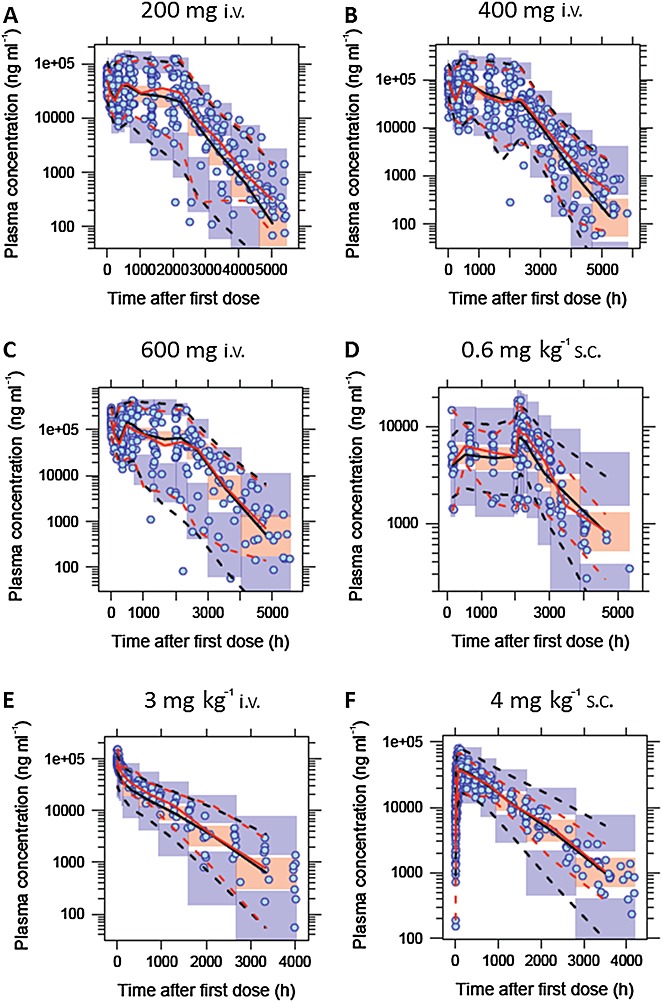
Visual predictive check for the final model stratified by dose. Examples included are A) 200 mg i.v. (study 5, UC patients), B) 400 mg i.v. (study 5, UC patients), C) 600 mg i.v. (study 5, UC patients), D) 0.6 mg kg–1 s.c. (study 4, moderate to severe asthma patients), E) 3 mg kg–1 i.v. (study 1, mild to moderate asthma patients) and F) 4 mg kg–1 s.c. (studies 1 and 2, healthy volunteers and mild to moderate asthma patients). The circles show the observed data. The solid red lines represent the median of the observed data. The broken red lines represent the 5th and 95th percentiles of the observed data. The solid black lines represent the simulated median and the orange shaded area represents its 95% confidence interval. The broken black lines represent the 5th and 95th percentiles based on simulation and the blue shaded areas around the broken black lines represent their the 95% confidence interval, respectively