
Figure 2.
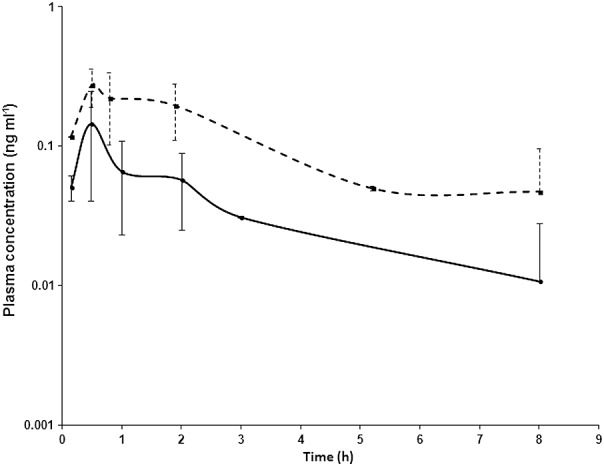
Semilog plots of the dose-normalized mean PARA plasma concentration–time profiles after administration of either oral single therapeutic doses or a single 6 ng kg–1 microdose. Results are presented as mean ± 1 SD.  therapeutic dose;
  microdose