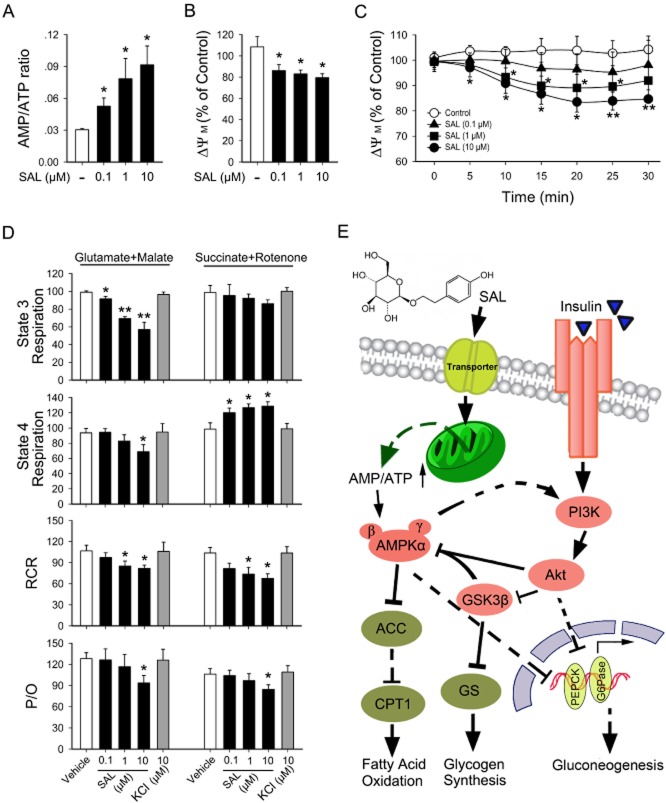
Figure 8.
Activation of AMPK results from cellular metabolic changes induced by salidroside. Primary mouse hepatocytes were incubated in the serum-free medium overnight and treated with SAL (0.1, 1, 10 μM) for 12 h and then cellular AMP/ATP levels (A) were measured. After serum starvation, HepG2 were pretreated as described in Methods, the fluorescence was detected and Δψm was calculated (B, C). Oxygen consumption rates in isolated mitochondria were determined after treatment with SAL or KCl in the presence of substrates for complex I or II (D). The representative trace of this assay is referenced in Supporting Information Fig. S2C. Schematic diagram of SAL's action (E). CPT1, carnitine palmitoyltransferase 1; GS, glycogen synthase. *P < 0.05, **P < 0.01 versus control. Values are means ± SEM (n = 4).

