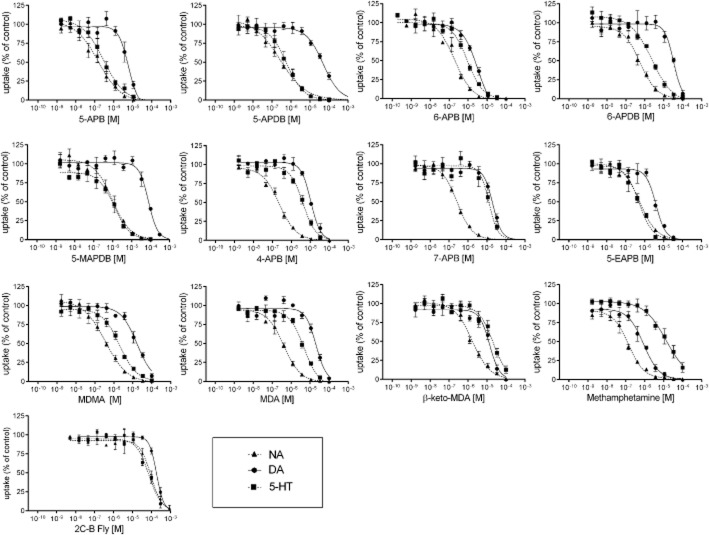
Figure 2.
Monoamine uptake transporter inhibition. Concentration–response curves show the uptake inhibition of [3H]-NA, [3H]-dopamine and [3H]-5-HT in HEK 293 cells transfected with the respective monoamine transporter. The data are expressed as the mean ± SEM of three to four independents experiments. Curves were fitted to the data with non-linear regression. The corresponding IC50 values are shown in Table 1.

