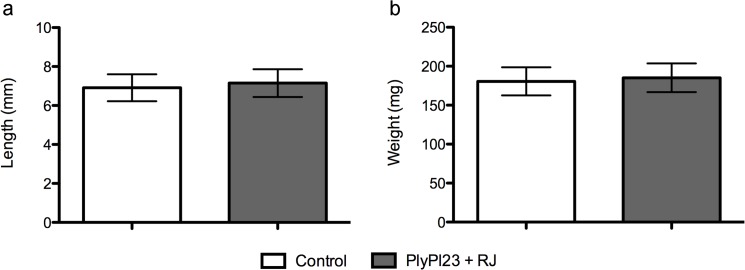
Fig 5. Variation in the larvae C-length and weight with PlyPl23 ingestion.
Data presented refers to the increase of C-length (a) and larvae weight (b) between the 2nd and the 5th day. Comparison between the test group, that received diet supplemented with 2.0 μM PlyPl23 and the control group, receiving diet with buffer Tris pH = 8.0. Each column represents the mean of 13 larvae and error bars indicate the standard deviation (10%).

