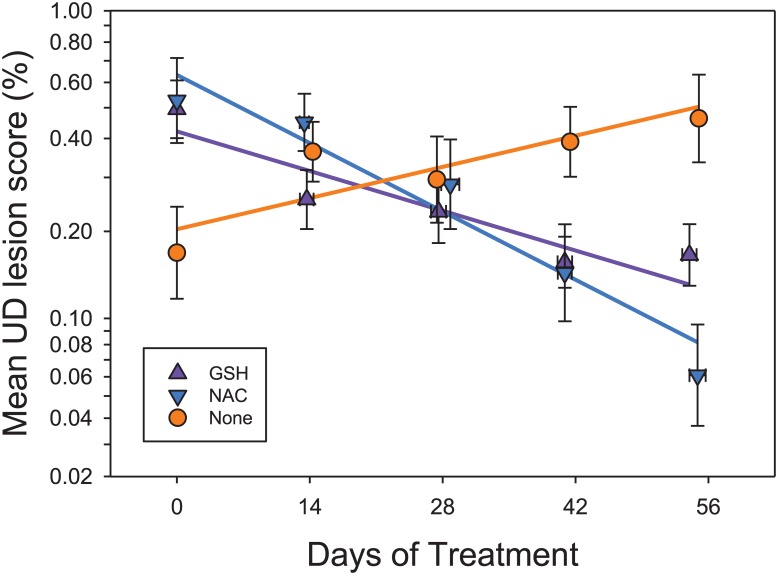
Fig 1. Mean UD lesion score as a function of time.
Probands did not differ in mean score at week 0. However, cagemates of probands who later developed UD are included, reducing the mean score for ‘None’ animals at week 0. Data are shown as the arithmetic mean +/- SE of the lesion scores corrected for subject, averaged at each week (horizontal error bars show the SE of the day of observation). Post-hoc tests of the slopes are shown in Fig 2.

