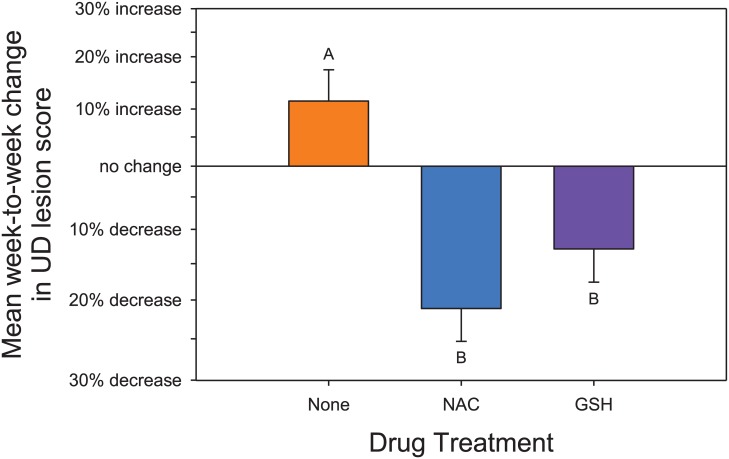
Fig 2. Weekly change in % of lesion score.
The data in Fig 1 is shown as the mean rate of change for each treatment. Data are figured as the % change per week in Lesion score. Means with the same subscript do not differ significantly. Both NAC and GSH treated animals showed a significant decrease in lesion scores over time.

