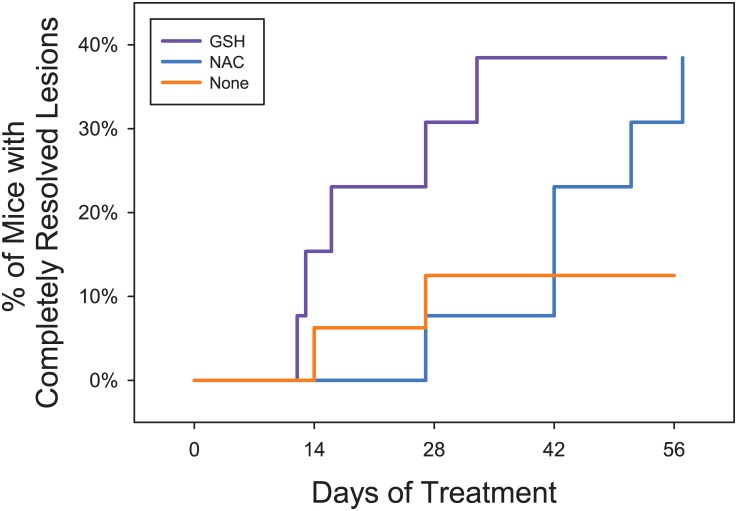
Fig 4. Percentage of Mice Cured Over Time.
The raw event data behind Fig 3 are shown. Euthanasia and cure events cannot be show on the same graph, however the final percentage of animals cured also reflects the cumulative proportion of animals euthanized by the end of the study (i.e. every non-cured animal was euthanized at some point during the study according to our human endpoints).

