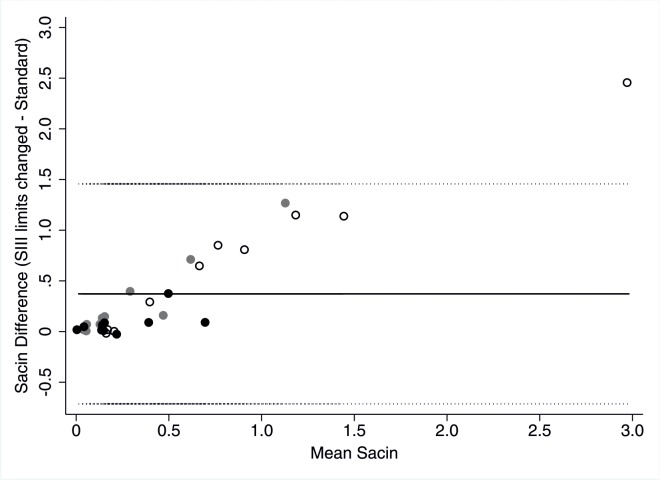
Fig 4. Sacin measurement bias due to changed setting for limits of SIII calculation.
Bland Altmann plot of Sacin determined with changed limits for SIII calculation from 65–95% to 50–80% of expired volume minus baseline Sacin versus mean of Sacin. Black circles represent children with CF, grey circles former preterm and open circles healthy children. Solid line represent mean difference (0.372), dotted lines represent upper (1.457) and lower (-0.713) limits of agreement.

