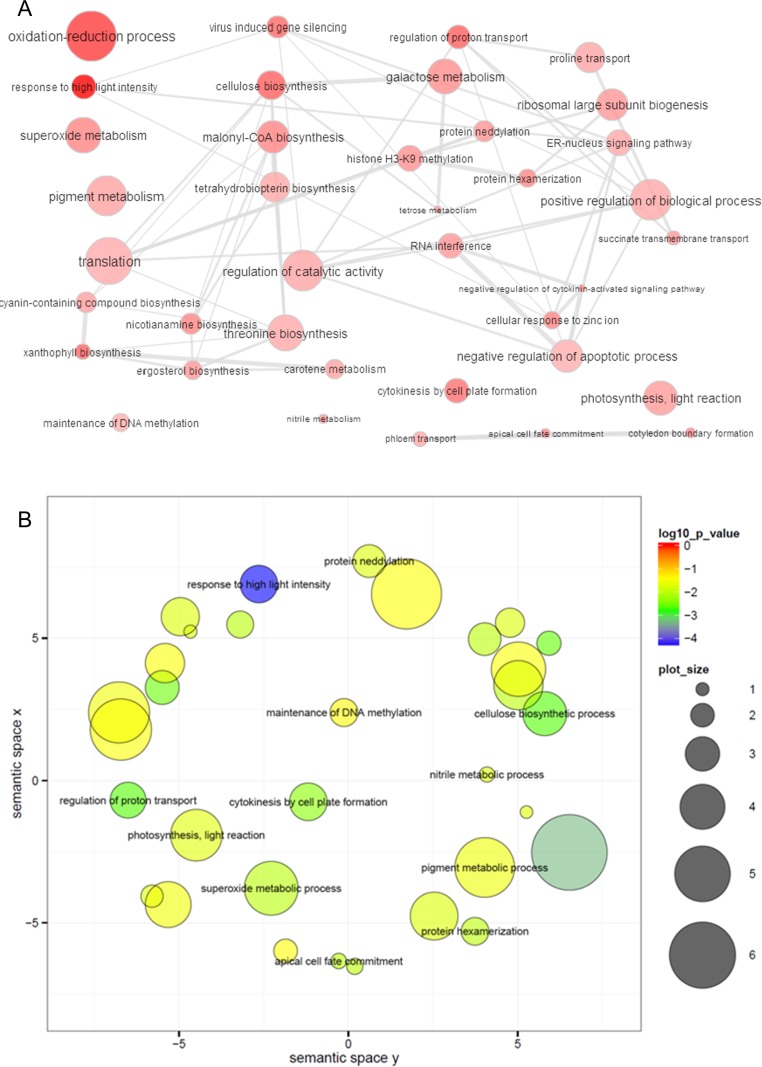
Fig 1. GO enrichment analysis of DEGs between high and low oleoresin-yielding masson pines using REVIGO.
(A) The interactive graph of the enriched GO terms for DEGs. Bubble color indicates the p-value; bubble size indicates the frequency of the GO term. Highly similar GO terms are linked by edges in the graph, where the line width indicates the degree of similarity. (B) The scatter plot showing the significance of the GO term for DEGs (terms remaining after reducing redundancy) in a two-dimensional space derived by applying multi-dimensional scaling to a matrix of GO term semantic similarities. Bubble color indicates the p-value for the false discovery rates. The circle size represents the frequency of the GO term (more general terms are represented by larger size bubbles).

