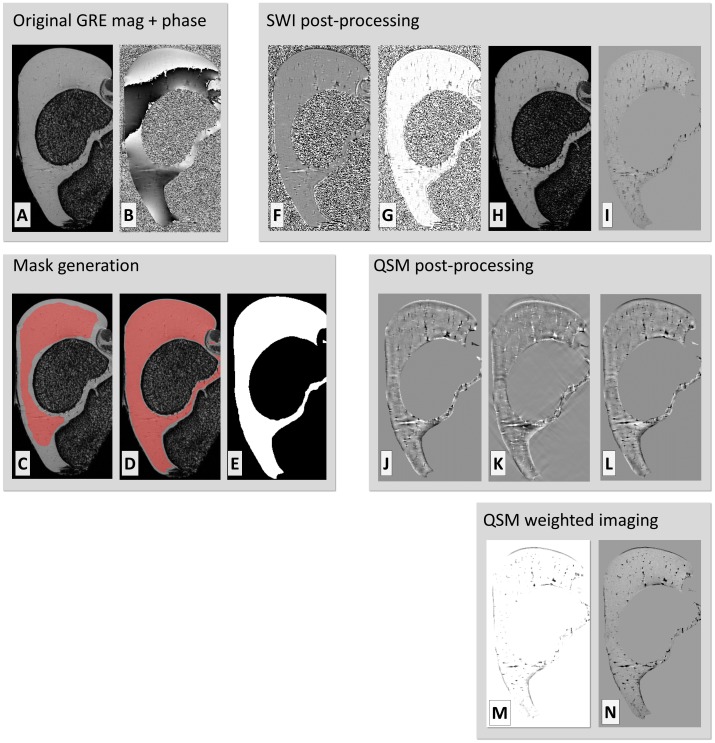
Fig 1. Main pre- and post-processing steps for SWI, QSM and QSM-WI.
Main pre- and post-processing steps depicted for a single slice (in a plane parallel to B 0) from the distal femur of a 3-week-old pig at 9.4 T. Original GRE magnitude (A) and phase (B). Generation of segmentation mask was initiated with a single-slice manual ROI (C), which was extended to the entire 3-D volume automatically (D), generating a segmentation mask for further processing (E). In SWI post-processing, high-pass filtering of the phase was first done using homodyne filtering (F). The phase was converted to a negative phase mask (G) and the SWI data was generated by applying the phase mask to the original magnitude data (H). Finally the segmentation mask was also applied to the SWI data for further visualizations (I). For QSM post-processing, the phase was first processed using Laplacian and SHARP filtering (J) and, in turn, converted to a quantitative susceptibility map with k-space inversion (K) and masked with the segmentation and contrast-inverted to match the appearance of SWI (L). Finally, the susceptibility map was converted into an enhancing mask (M) and finally applied to the magnitude data to generate a QSM-WI dataset (N).

