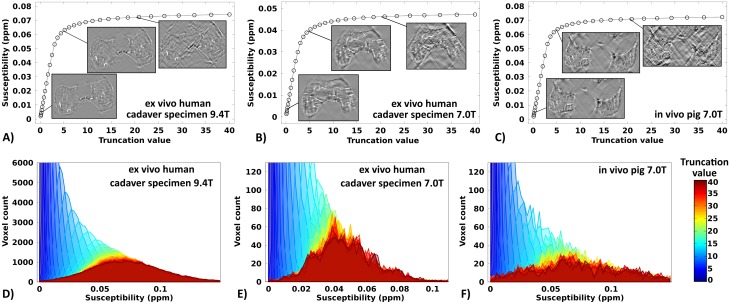
Fig 2. Quantitative susceptibility values of the cartilage canals.
Relative susceptibility values of the cartilage canals with respect to the surrounding tissue in a 1-month-old human cadaveric distal femur scanned at 9.4 T (A) and at 7.0 T (B), and in a 3-week-old piglet scanned at 7.0 T in vivo (C) as a function of the truncation factor used in the k-space dipole inversion. Inset images in A-C depict single slices from the quantitative susceptibility maps at truncation factor values of 0.5, 5 and 20 at an intensity scale normalized with the intensity of the cartilage canals to facilitate visual comparison of the streaking artifacts. The second row shows the susceptibility histograms acquired for the corresponding cartilage canal ROIs for the respective specimens as a function of the truncation factor (D-F).

