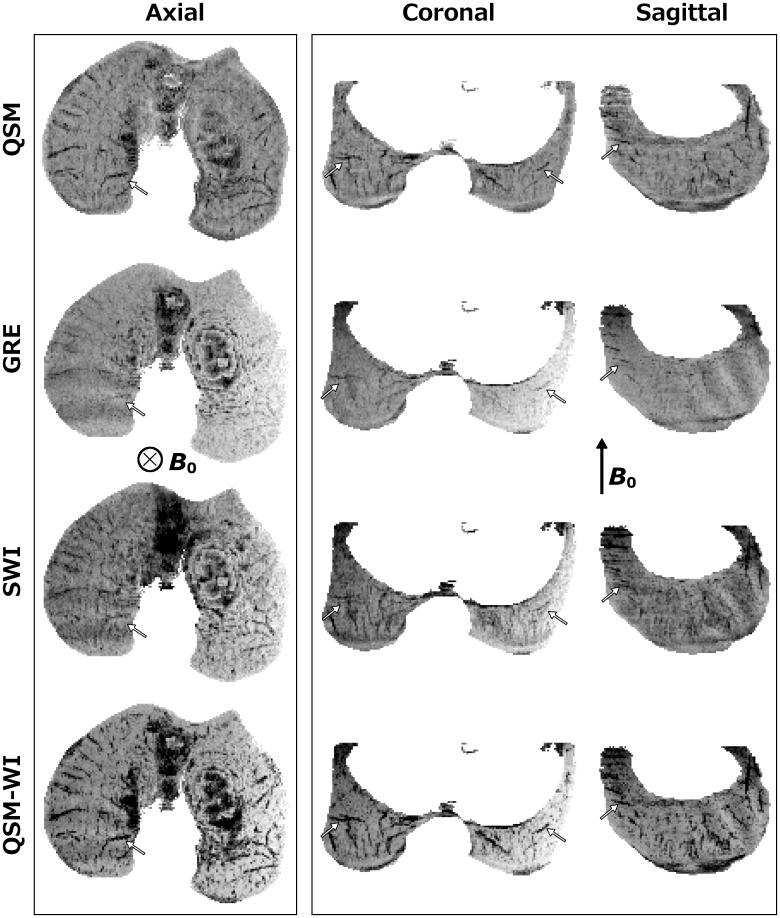
Fig 5. Comparison of QSM, plain GRE, SWI and QSM-WI at 7.0 T in vivo.
Comparison of QSM, GRE, SWI and QSM-WI of a 3-week-old piglet scanned at 7.0 T in vivo. In the first pane, showing an axial plane perpendicular to B0, the datasets appeared visually similar. In the second pane, with views parallel to B0, artifactual splitting of the vessels was observed for the SWI data while both QSM datasets and the unprocessed GRE appeared artifact-free.

