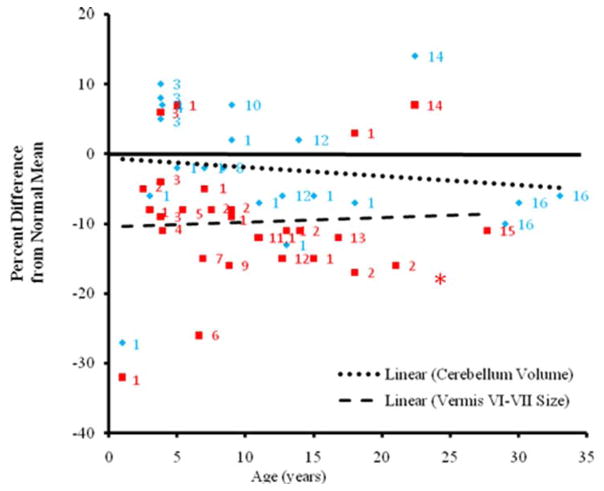
Figure 5.
Cerebellum and Vermis Size from Infancy to Adulthood in Autism. Percent differences from normal average in each study for autistic subjects are plotted for cerebellar volume (blue diamonds) and vermis lobules VI–VII cross-sectional area (red squares) against age. Regression lines are shown for cerebellar volume and vermis lobules VI–VII area. The solid line represents normal average. Each number represents a separate study: 1, Hashimoto et al., 1995; 2, Courchesne et al., 2001; 3, Akshoomoff et al., 2004; 4, Webb et al., 2009; 5, Carper et al., 2000; 6, Kleiman et al., 1992; 7, Kaufmann et al., 2003; 8, Kates et al., 2004; 9, Mitchell et. al., 2009; 10, Herbert et al., 2003; 11, Elia et al., 2000; 12, Cleavinger et. al., 2008; 13, Ciesielski et al., 1997; 14, Hardan et al., 2001; 15, Piven et al., 1992; 16, Hallahan et. al, 2009. Data point from first report of hypoplasia of vermis lobules VI–VII Courchesne et al., 1988 shown as red asterisk.

