
Fig. 5.
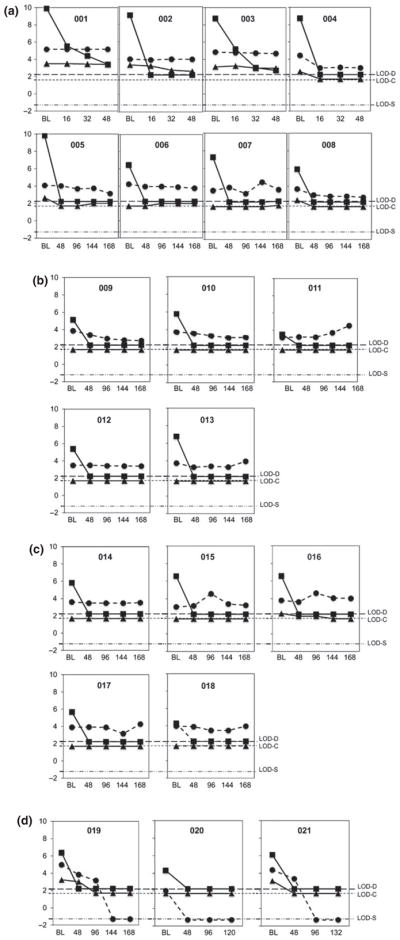
HBV DNA, HBcAg and HBsAg levels at baseline and during TDF therapy. Patients are grouped based on HBeAg status: HBeAg+ (a), HBeAg loss on TDF (b), HBeAg− pre-TDF therapy (c), and HBeAg and HBsAg loss on TDF therapy (d). Patient numbers and time points of serum collection (BL, baseline; and weeks after the start of therapy) are indicated. Y-axis values are Log10: DNA in copies/mL (squares), HBcAg in ng/mL (triangles) and HBsAg in IU/mL (circles). Dashed lines show limits of detection (LOD) for viral DNA (D), HBcAg (C) and HBsAg (S). Time points of HBeAg loss were weeks 120, 84, 96, 108 and 120 for patients 009–013, respectively (b), and weeks 108, 48 and 84 for patients 019–021, respectively (d).