
Figure 1. Confocal Ca2+ in single myocytes within intact heart.
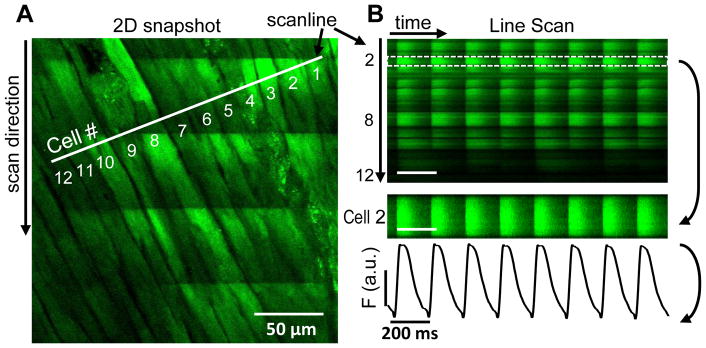
Two-dimensional image of observed area on left ventricular (LV) surface recorded with a point scanning confocal microscope shows position of selected scan line on the epicardial LV surface (A). During image acquisition several Ca2+ transients are visible as increased fluorescence from top to bottom (as time elapses). The scan line image is used to analyze Ca2+ transients in individual single cells (B).