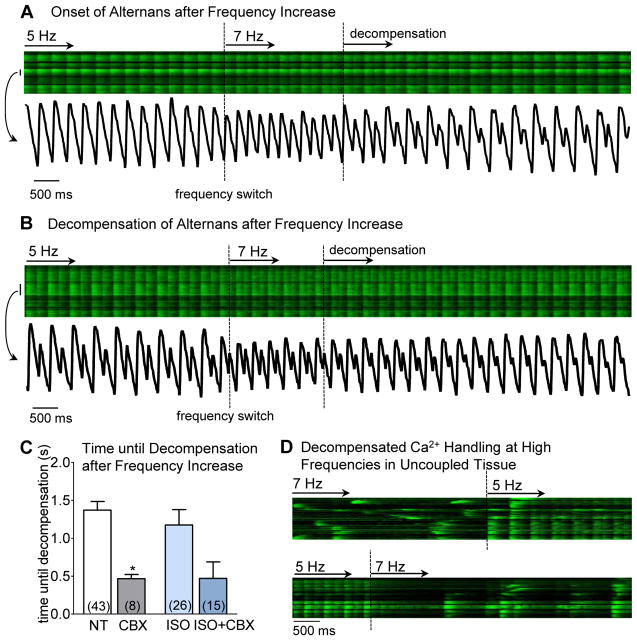
Figure 5. Transition from normal Ca2+ cycling to stable alternans.
An example of tissue in ISO during increase in stimulation frequency from 5 to 7 Hz with intensity plot for the cell marked with a bar (A). Dashed lines indicate frequency change and transition to decompensated Ca2+ handling (alternans). B another example where alternans was already present at 5 Hz (r = 0.454) and upon frequency increase (first dashed line) the ratio was slightly reduced to r = 0.417, but then increased to r= 0.55 and 0.85 after decompensation (at second dashed line). Time frame until decompensation was reduced by GJ uncoupling in NT and ISO similarly (C). During β-AR stimulation some episodes of decompensated Ca2+ handling were observed where cells only recovered upon frequency decrease (D).

