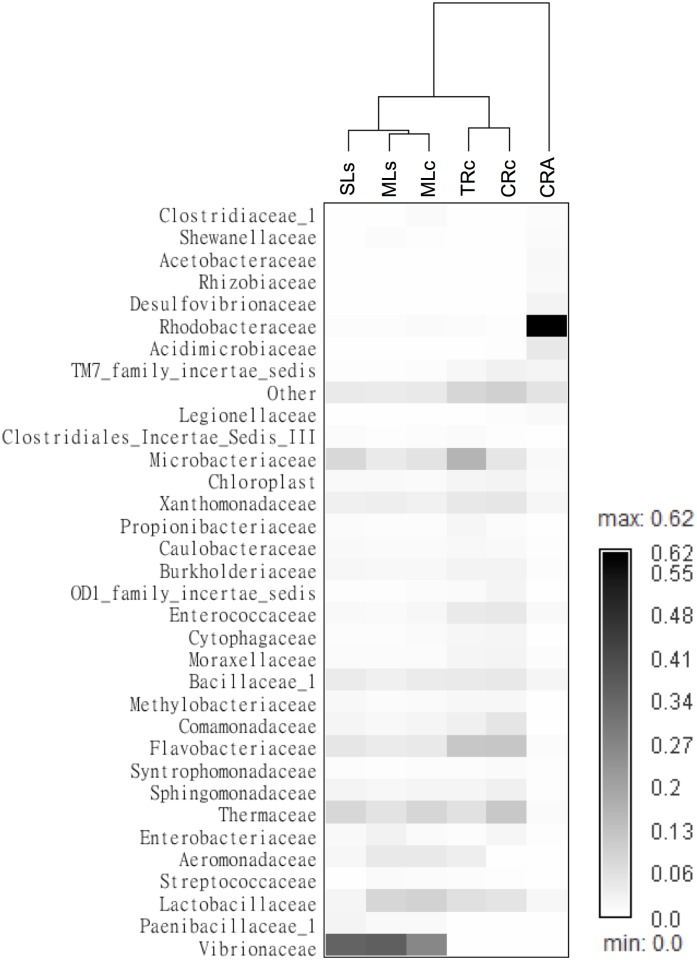
Fig 3. Frequency of OTUs in the shrimp gut microbiomes represented as a heatmap.
Shrimp samples were hierarchical clustered based on the correlation matrix of samples calculated by Spearman’s rank. The OTUs were analyzed in family level and only families that made up more than 1% sequences of the library were shown, the rest of the OTUs were grouped as “others”.

