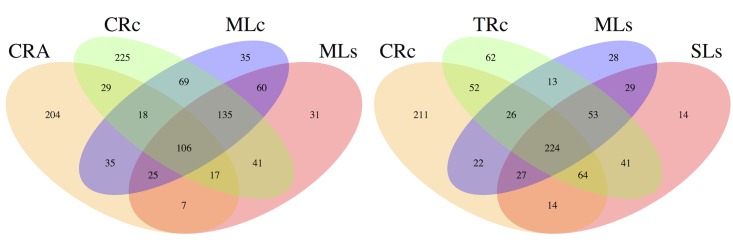
Fig 5. Shared OTUs analysis of sequencing reads obtained from six libraries.

A: The Venn diagram represents the share and unique OTUs between shrimps M. nipponense and M. asperulum. B: The Venn diagram represents the share and unique OTUs between shrimps dwelling in lakes and/or rivers.
