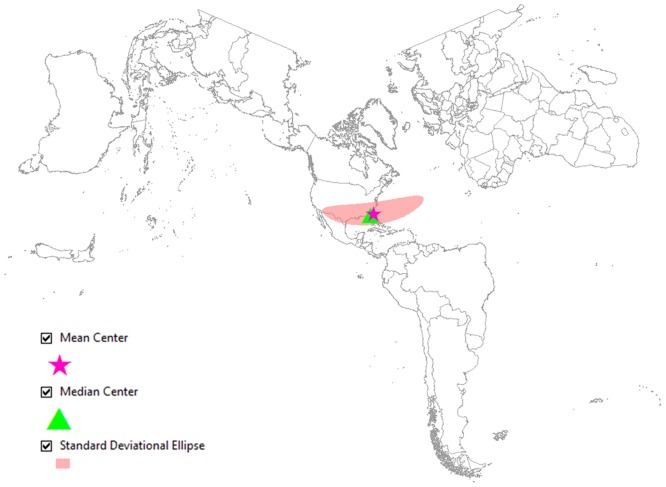
Fig 7. Twitter users with regional and local levels of awareness from Jacksonville, FL.
The map shows the central tendency, dispersion and directional trends of the tweets mapped in Fig 5. The narrow ellipse shows that the users are more aware of regional and local cities rather than international cities. Map projection: Lambert Conformal Conic. (S3 Table)

