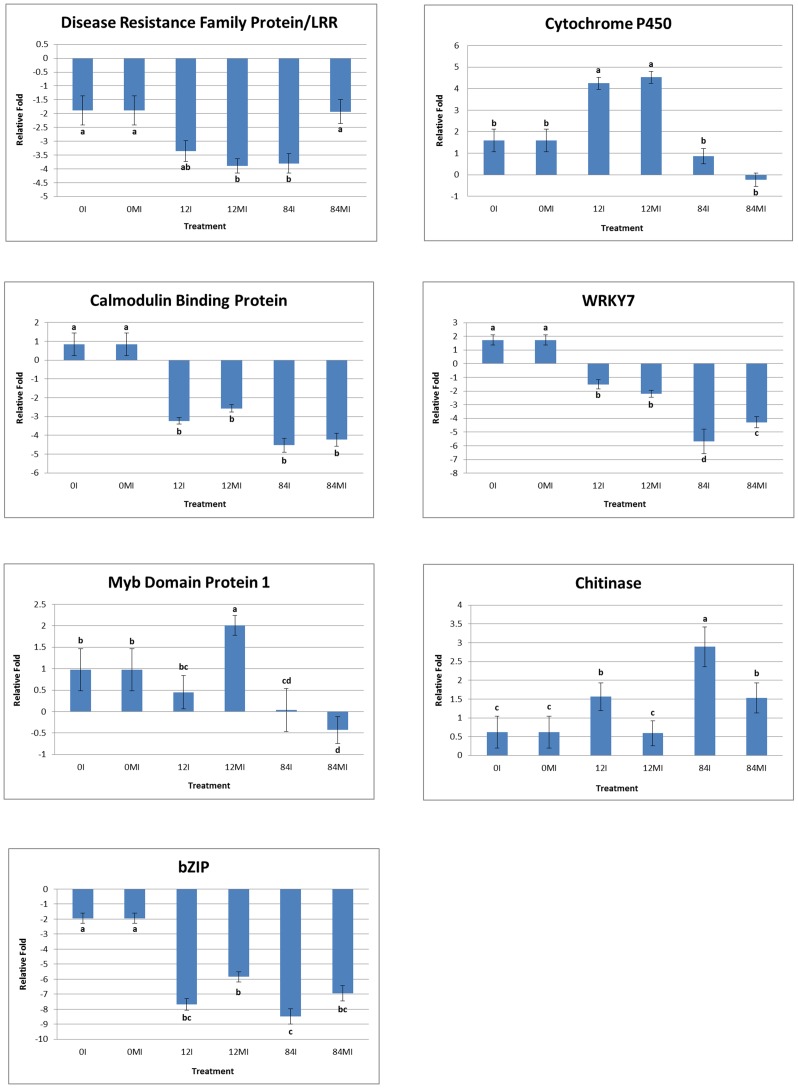
Fig 8. Validation of the relative expression levels of seven selected genes from RNA-Seq analysis by quantitative Real-Time RT-PCR (qPCR).
Expression pattern of selected common bean genes in mock-inoculated and rust-inoculated leaf samples at different time points. The x-axis shows different time point and y-axis shows relative fold change value (Log2FC). Different alphabets in this Figure indicate statistically significant (p-value<0.05) difference in relative expression of each gene between different time points (0, 12, 84 hai) for both inoculated and mock-inoculated leaf samples. The qPCR results from two technical replicates were subjected to ANOVA by using Minitab17 software.

