
Fig 2. Dependence of tumorsphere growth on culture medium in 2D versus 3D for MDA231 cells.
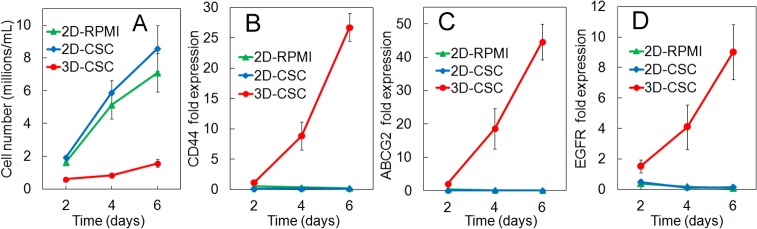
Number density (A) and mRNA expression of CD44 (B), ABCG2 (C), and EGFR (D) markers for MDA231 cells as a function of incubation time. Groups included cells on 2D adherent plates and cultured in RPMI-1640 medium (2D-RPMI), cells on 2D plates and cultured in CSC medium (2D-CSC), and cells encapsulated in the 5 kPa PEGDA gel and cultured in CSC medium (3D-CSC). An Asterisk in (A) indicates a statistically lower (p<0.05) cell number in the test group compared to 2D groups at the same time point. An Asterisk in (B-D) indicates a statistically higher (p<0.05) mRNA expression in the test group compared to 2D groups at the same time point. The p-values for the asterisks in (A-D) are listed in Tables E-H in S1 File. Error bars correspond to means±1 SD for n = 3.