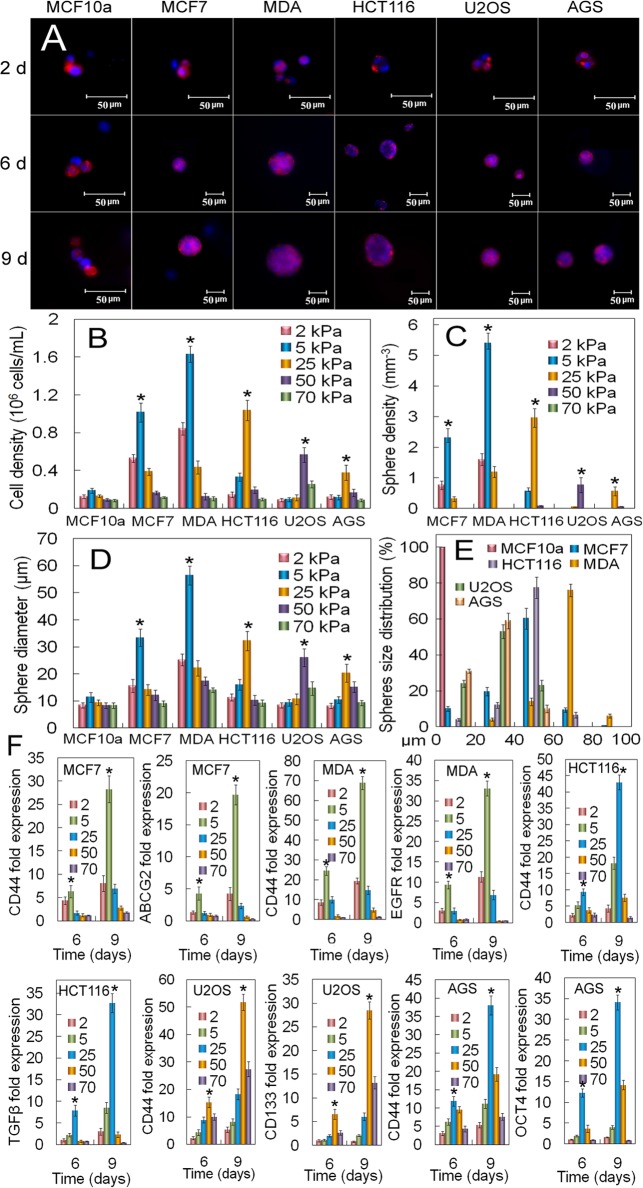
Fig 5. Dependence of the optimum gel modulus for CSC growth on tissue origin of cancer cells.
(A) DAPI (blue) and phalloidin (red) stained images of MCF10A, MCF7, MDA231, HCT116, U2OS, and AGS cancer cells encapsulated in the un-patterned gels after 2, 6, and 9 days of incubation (scale bars in A are 50 μm). Cell number (B), tumorsphere number (C), tumorsphere diameter (D), and tumorsphere size distribution (E) as a function of cancer cell type after 9 days of encapsulation for gel moduli of 2 (pink), 5 (blue), 25 (brown), 50 (purple), and 70 (green) kPa. The gel modulus in (A and E) was the optimum PEGDA modulus of 5 kPa for MCF7 and MDA231 cells; 25 kPa for HCT116 and AGS; 50 kPa for U2OS. (F) mRNA expression of CSC markers for MCF7 (CD44 and ABCG2), MDA231 (CD44 and EGFR), HCT116 (CD44 and TGF-β), U2OS (CD44 and CD133), and AGS (CD44 and OCT4) after 6 and 9 days of encapsulation for gel moduli of 2 (pink), 5 (blue), 25 (brown), 50 (purple), and 70 (green) kPa. An asterisk in (B-D) indicates a statistically higher (p<0.05) cell number, sphere number and size for the test modulus compared to all other moduli for a given cell type. An asterisk in (F) indicates a statistically higher (p<0.05) marker expression level for the test modulus compared to all other moduli for a given cell type and at a given time. The p-values for the asterisks in (B-D,F) are listed in Tables I-U in S1 File. Error bars correspond to mean±1 SD for n = 3.

