
Fig 4. Topology resulting from maximum parsimony analysis of one 4-gene dataset using MEGA5.0.
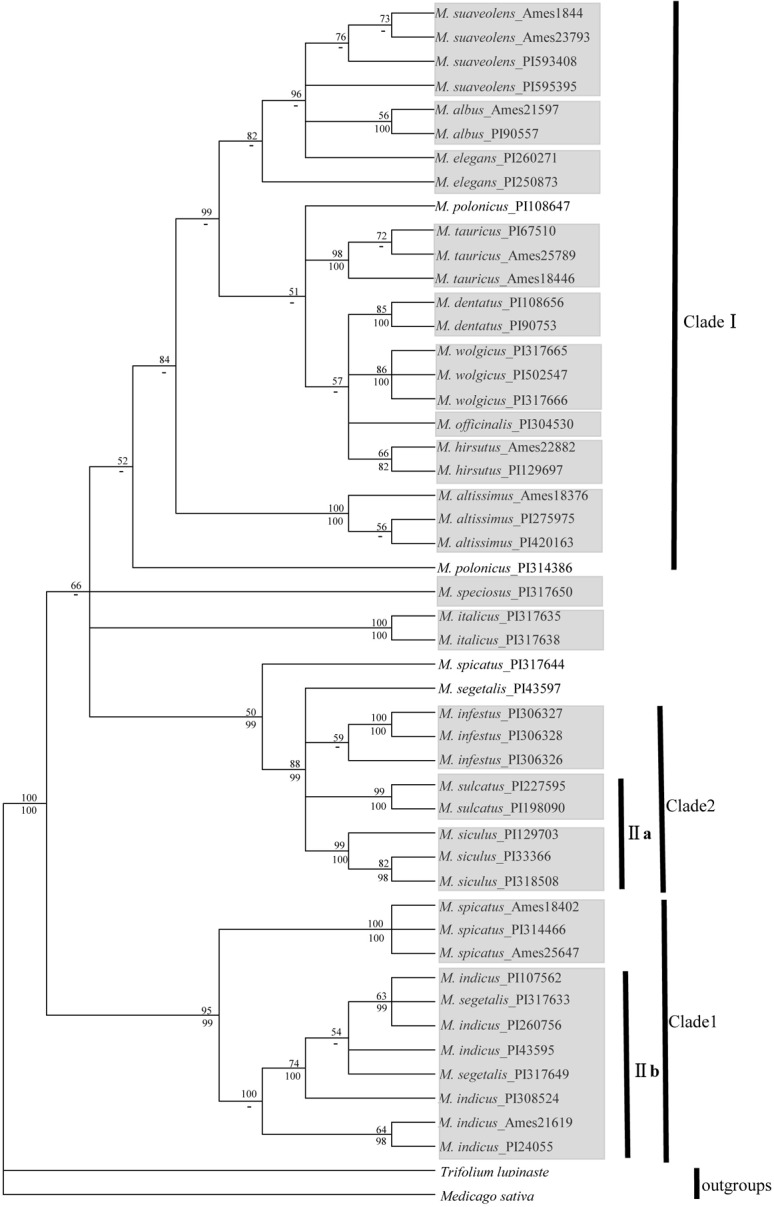
Bootstrap support values (> 50%) are indicated above the branches (posterior values from the corresponding Bayesian analysis are provided below the branches;-: node not recognized). The populations of the same species clustering together are indicated in a grey box. The definitions of clades follow those of Fig 1 and Fig 2.