Figure 3.

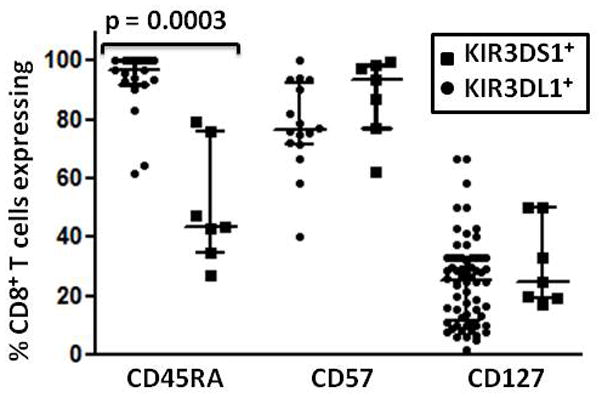
Distribution of KIR3DL1/S1+CD8+ T cell phenotypes. The percentage of KIR3DL1+ and KIR3DS1+ CD8+ T cells expressing CD45RA, CD57 and CD127 in groups of HIV-infected KIR3DL1 or KIR3DS1 homozygous individuals was compared by flow cytometry.

Distribution of KIR3DL1/S1+CD8+ T cell phenotypes. The percentage of KIR3DL1+ and KIR3DS1+ CD8+ T cells expressing CD45RA, CD57 and CD127 in groups of HIV-infected KIR3DL1 or KIR3DS1 homozygous individuals was compared by flow cytometry.